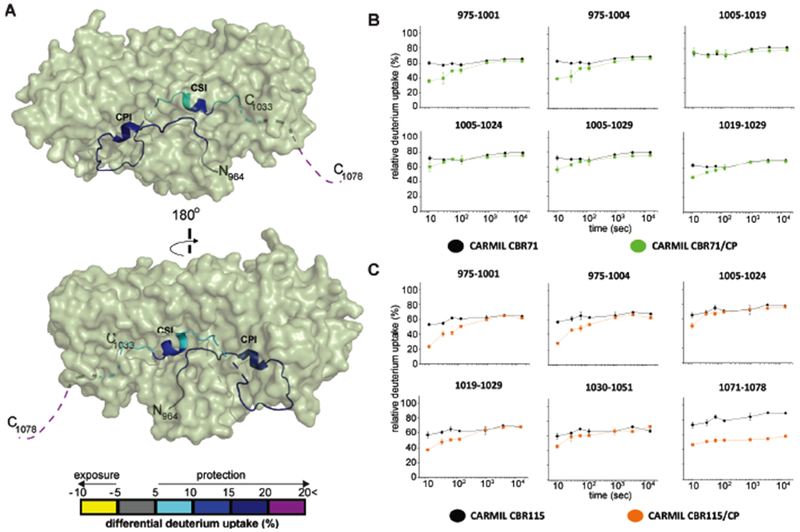
Figure 6. HDX-MS analysis of CARMIL CBR71 and CARMIL CBR115, comparing CP complexes with free CARMIL fragments.

(A) Two views of a cartoon representation of a co-crystal structure of CARMIL CBR115 peptide (ribbon) and CP (green surface), based on PDB 3LK3 (Hernandez-Valladares et al., 2010). Unresolved CARMIL CBR115 residues 1005-1020 between CPI and CSI motifs and C-terminal residues 1034-1078 (CAH3c) are indicated as dashed lines. Differences in deuterium uptake induced by CP binding to CARMIL CBR115 are displayed as a color gradient (see scale at bottom) and highlighted in the ribbon representation of CARMIL CBR115. (B) Deuterium uptake curves for all CARMIL CBR71 peptides are shown for free (black) and CP-bound (green) states. (C) Deuterium uptake curves for CARMIL CBR115 peptides are shown for free (black) and CP-bound (orange) states. Data are representative of two independent experiments.
