Figure 3.

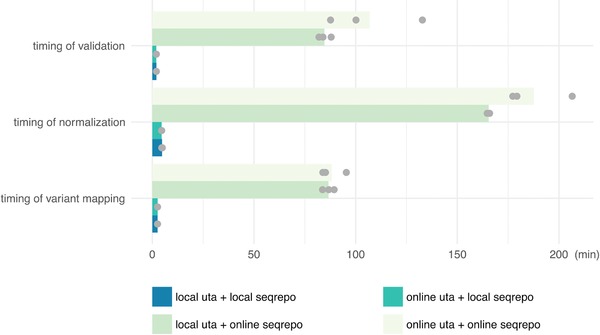
Timing of mapping, normalization and validation of variants with online data sources and local data sources. Each configuration was run three times independently (grey dots). Each bar was the average of all timings

Timing of mapping, normalization and validation of variants with online data sources and local data sources. Each configuration was run three times independently (grey dots). Each bar was the average of all timings