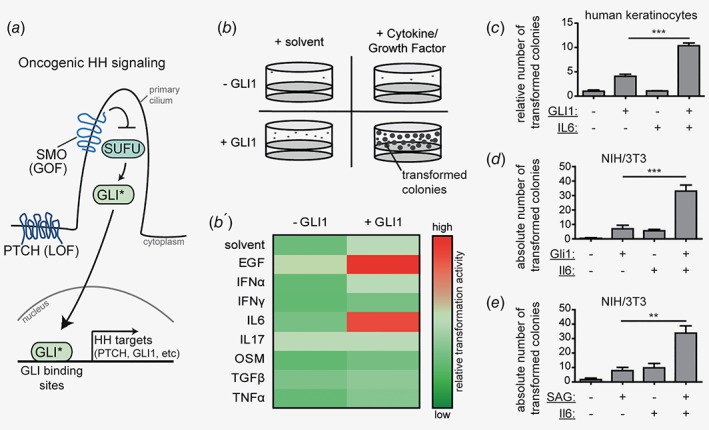
Figure 1.

IL6 synergizes with HH/GLI signaling in oncogenic transformation.(a) Schematic illustration of linear, canonical HH/GLI signaling in the absence of signal cross‐talk. Loss‐of‐function mutations (LOF) in patched (PTCH) or gain‐of‐function mutations (GOF) in smoothened (SMO) account for the majority of BCC by releasing the GLI zinc‐finger transcription factors from their inhibitor suppressor of fused (SUFU). Nuclear translocation of GLI activator forms (GLI*) leads to the onset of transcriptional activation of HH/GLI target genes.(b) Scheme of screen for oncogenic HH modifiers. Nontumorigenic, human HaCaT keratinocytes were grown in in vitro transformation assays and four conditions were tested: cells were either left untreated and served as solvent‐only control (+solvent;‐GLI1), treated with cytokines or growth factors (+cytokine/growth factor;−GLI1), expressed GLI1 (+solvent;+GLI1) or a combination of both (+cytokine/growth factor;+GLI1). The number of transformed colonies served as readout. (b′) Heat‐map analysis of the in vitro screen for oncogenic HH modifiers. Changes in spheroid numbers are depicted relative to GLI1‐expressing cells treated with solvent only (+solvent;+GLI1). Red color indicates a synergistic increase in the number of transformed colonies.(c) Quantitative results of in vitro transformation assays of human HaCaT keratinocytes after GLI1 activation in combination with or without IL6 treatment.(d) Quantitative results of in vitro transformation assay of Gli1 expressing mouse NIH/3T3 cells with or without Il6 treatment as indicated. Empty vector not expressing Gli1 served as control.(e) Quantitative results of in vitro transformation assay of SAG‐responsive NIH/3 T3 cells upon SAG (100 nM) with or without Il6 stimulation as indicated.Statistical analysis by Student's t test; ***p < 0.001; **p < 0.01.
