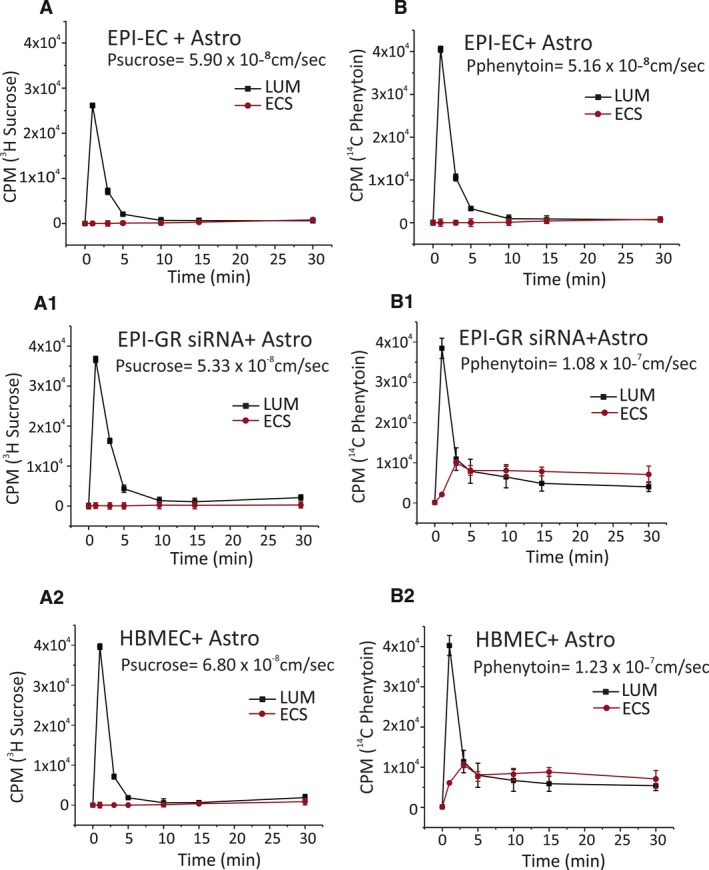
Figure 3.

Permeability of [3H]sucrose and [14C]phenytoin in EPI‐EC GR siRNA, EPI‐EC non‐siRNA, and HBMEC DIV‐BBB. A‐A2, The tightness of the barrier evaluated by [3H]sucrose (a paracellular marker) shows no significant difference across the endothelium(s) used. B‐B2, [14C]phenytoin showed a 2.1‐fold increase in permeability levels (1.08 × 10⁻⁷ cm/s) in EPI‐EC GR siRNA DIV‐BBB (P ≤ 0.05) compared with EPI‐EC non‐siRNA BBB (5.16 × 10⁻⁸ cm/s). The permeability pattern in EPI‐EC GR siRNA at the DIV‐BBB was comparable to that of HBMEC DIV‐BBB (1.23 × 10⁻⁷ cm/s)
