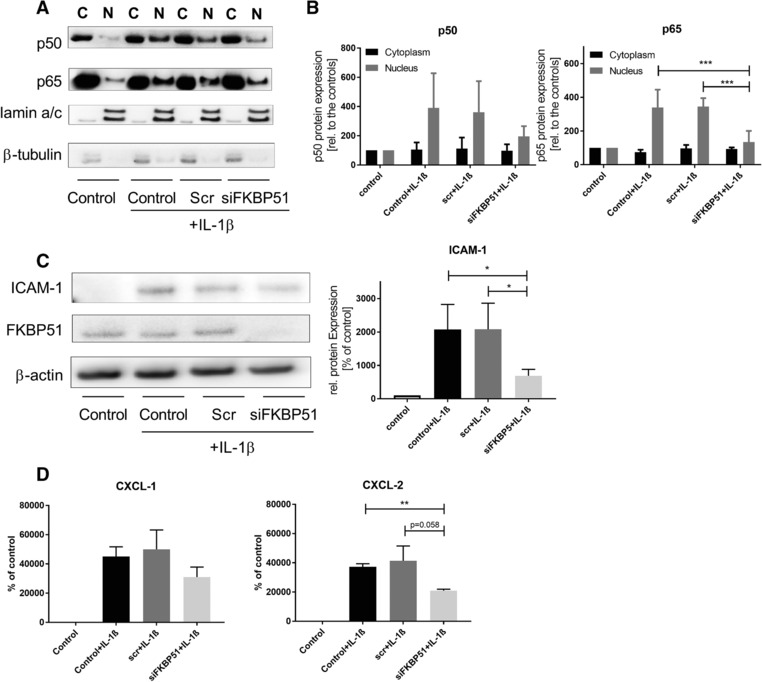
Figure 5.

Modulation of NFκB signaling by FKBP51 knock down. (A) Nucleus translocation of p50/p65 after IL‐1ß stimulation. A549 cells were transfected with siRNAs and treated with IL‐1β. Cytoplasmic (C) and nucleic (N) fractions were separated as it is described in the material and method part. One representative western blot of three independent experiments is shown. The order of the western blot samples is the same like in the western blot quantitation of B. (B) Quantitation of p50/p65 cytoplasm and nucleus fractions. Western blots were quantified using densitometry of the single bands, normalized with the appropriate housekeeper (lamin for nucleic fractions, beta tubulin for cytoplasmic fractions). Cytoplasmic samples were relatively compared to the cytoplasmic control, nucleic samples were relatively compared to the nucleic control. Bar graphs are means ±SD of three independent experiments (n = 3). One way ANOVA, Dunnett's multiple comparisons test. *p < 0.05 C) Protein expression of ICAM‐1 in A549 cells. One representative western blot of four independent experiments is shown (n = 4). A549 cells were RNAi transfected and treated with 0.5 ng/mL IL‐1ß. Samples were relatively compared to the control. Bar graph shows mean values ± SD of all four independent experiments (n = 4). One way ANOVA, Dunnett's multiple comparisons test. *p < 0.05 D) Quantitation of NFκB mediated release of CXCL‐1/2. A549 cells were treated like described above. Supernatants were collected 16 h after stimulation and samples are compared to the control and given as relative values. Statistics: Both graphs in (D) show means ±SEM of 4 independent experiments (CXCL‐1) or 3 independent experiments (CXCL‐2). One‐way ANOVA, Tukey or Dunnet post‐test **p<0.01.
