
Figure 1.
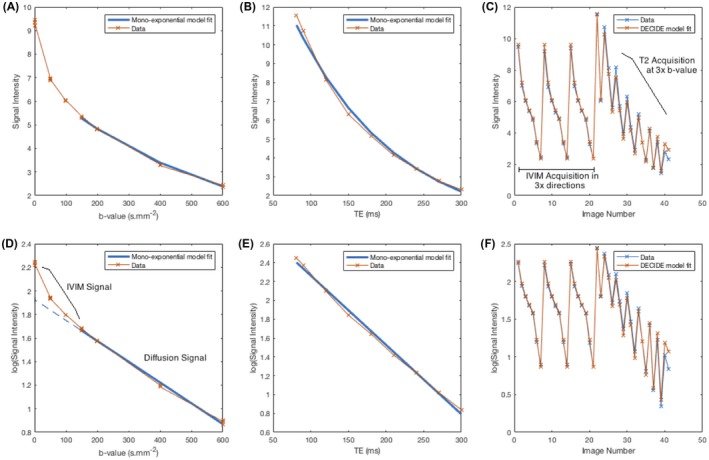
Whole‐placenta curve fitting results for fixed echo‐time IVIM imaging (case 2) for signal (A) and log‐signal (D) (curve fitting for b > 100 s.mm–2). For zero b‐value, monoexponential relaxometry for signal (B) and log‐signal (E). For DECIDE fitting (Equation ((3))), a single model‐fitting procedure to all acquired images for signal (C) and log‐signal (F)