
Figure 7.
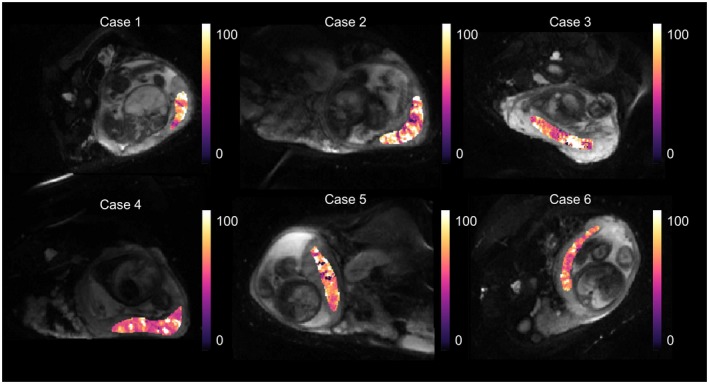
Parametric maps for the voxel‐wise fit of fetal blood oxygen saturation, derived from fetal blood T2 relaxation time. A histogram showing the voxel‐wise fit for the whole‐placenta data is shown in Figure 8. Mean fetal blood saturation over the whole data set (s < 100%) was 72.93 (±20.11)%