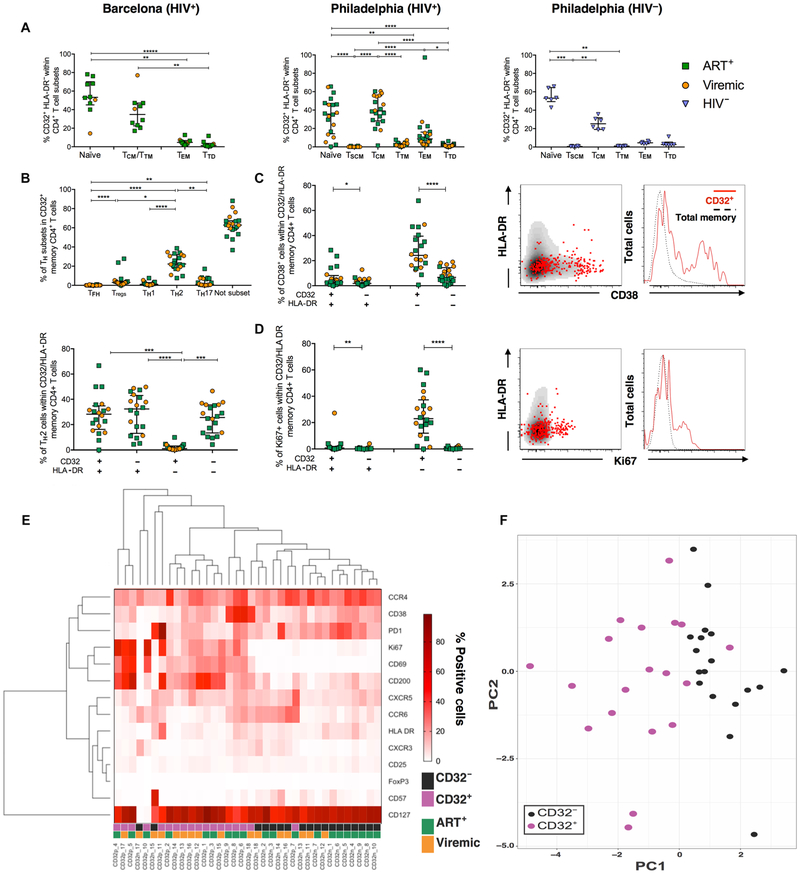
Fig. 2. CD32+ cells have a distinctively different phenotype compared to CD32− cells.
(A) Distribution of CD32+ HLA-DR-within cell subsets in viremic, ART-treated HIV+ and HIV− donors. In the Barcelona cohort, subsets were defined as naïve (CD45RO− CD27+), Ttd (CD45RO− CD27−), effector memory T cells (TEM) (CD45RO+ CD27−), and central memory T cells (TCM)/transitional memory T cells (TTM) (CD45RO+ CD27+). In the Philadelphia cohort, subsets were defined as naïve (CD45RA+ CD27+ CCR7+ CD95−), stem memory T cells (TSCM) (CD45RA+ CD27+ CCR7+ CD95+), TTD (CD45RA+ CD27−), TEM (CD45RA− CD27−), TCM (CD45RA− CD27+ CCR7+), and TTM (CD45RA− CD27+ CCR7−). (B) Frequencies of TH subsets within memory CD32+ CD4+ T cells (top) and their distribution within HLA-DR+/− TH2 CD32+ CD4+ T cells (bottom). Not subset refers to those cells that did not fall into the defined TH subsets. (C and D) Frequency of CD38+ (C) and Ki67+ (D) cells in CD32/HLA-DR-expressing memory CD4+ T cells. Representative examples are shown for each marker with overlaid plots showing CD32+ cells (red dots in plots and solid red lines in histograms) over total memory cells (black dots in plots and dotted lines in histograms). (E) Heat map showing the frequency of all measured phenotypic markers in CD32+ and CD32− cells. CD32p, memory CD32+ CD4+ T cells; CD32n, memory CD32− CD4+ T cells. (F) PCA showing the distribution of CD32+ and CD32− cell subsets. In all graphs, a line indicates the median of the group. All data were analyzed using a Friedman test (paired, nonparametric) and corrected for multiple comparisons with Dunnett’s posttest. n = 6 for HIV− controls, n = 12 for HIV+ ART+ individuals, and n = 8 for HIV+ viremic individuals. *P < 0.05, **P < 0.01, ***P < 0.001, and ****P < 0.0001.

