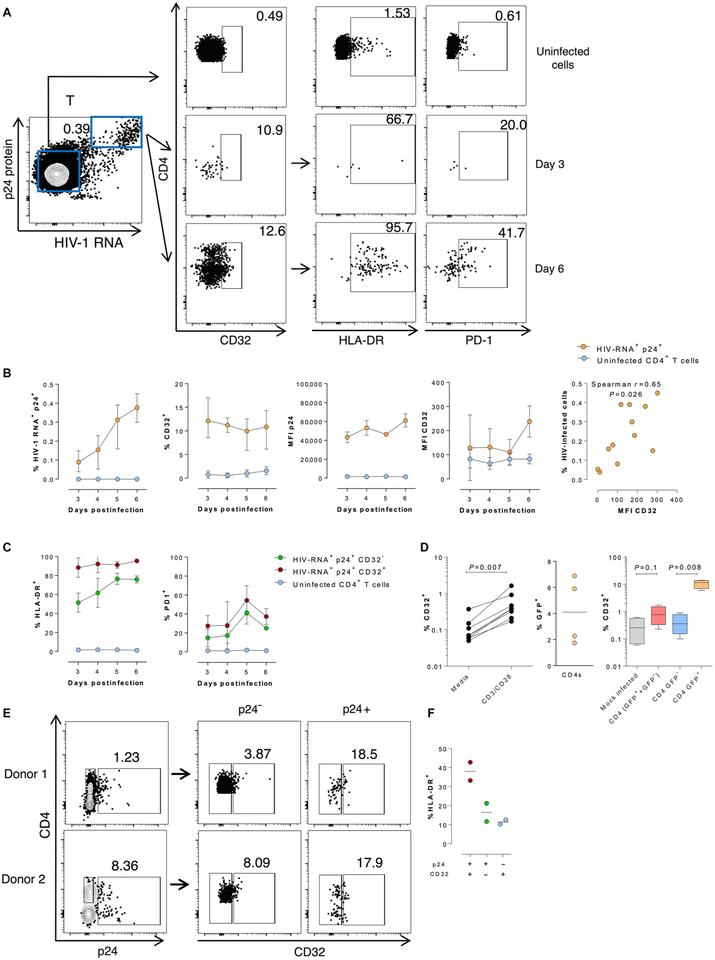
Fig. 4. CD32 expression associates with productive HIV infection in vitro in PBMCs and tissues.
Unfractionated and unstimulated PBMCs from three healthy donors were infected ex vivo with the HIV strain NL4–3. Cells were subjected to the RNA FISH-flow protocol on days 3, 4, 5, and 6 after infection to determine the expression of CD32 in the productively infected cell population (HIV-RNA+ p24+). (A) Left: A representative flow cytometry plot of dually stained T cells for HIV RNA and the p24 protein. Upper right panels show representative flow cytometry plots of CD32, HLA-DR, and PD-1 frequency and expression in uninfected cells. The plots in the middle and bottom right show the frequency and expression of CD32 in infected cells and the frequency of HLA-DR and PD-1 within infected CD32+ cells at days 3 and 6 after infection. (B) Percentages of productively HIV-infected cells (first graph) and percentages of infected cells expressing CD32 (second graph). MFI of p24 and CD32 expression productively infected (orange) and uninfected cells (blue) (third and fourth graphs). Correlation between the percentage of HIV-infected cells and CD32 expression (last graph). (C) Differential HLA-DR and PD-1 expression pattern of infected cells (green), cells coexpressing the CD32 marker (maroon), or uninfected cells (blue). Left graph shows the expression of the activation marker HLA-DR, and right graph shows the expression of PD-1. (D) Left graph: Percentages of CD32 expression in uninfected cells after exogenous stimulation with anti-CD3/CD28 microbeads. Middle graph: Percentages of HIV-infected cells after ex vivo infection of stimulated CD4+ T cells. Right graph: Percentages of CD32 expression after ex vivo infection of stimulated CD4+ T cells. (E) Cervical tissue ex vivo infection. Left graph: Representative flow cytometry plot of p24 protein detection in two of CD32 in HIV-infected cells and in uninfected CD4+ T cells. (F) Percentages of HLA-DR expression in infected cells expressing the CD32 marker (maroon), infected cells that do not express CD32 (green), and uninfected CD4+ T cells expressing CD32 (blue). Statistical comparisons were performed using paired t tests. n = 2.

