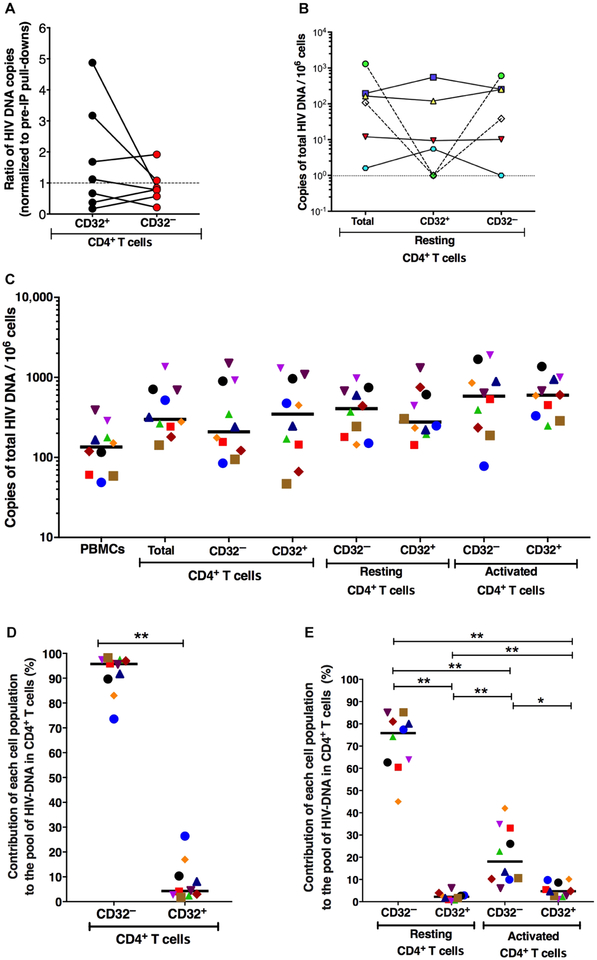
Fig. 5. No enrichment of HIV DNA in sorted CD32+ CD4+ T cells compared to CD32− CD4+ T cells and CD32+ resting CD4+ T cells contribute minimally to the total pool of HIV DNA in CD4+ T cells.
(A) Measurements of HIV DNA were performed on CD32 pull-downs with antibody-conjugated magnetic beads and compared to cell number normalized pre-immunoprecipitation (pre-IP) pull-downs (n = 7) on fresh cells. (B) HIV DNA load was measured from CD32+ resting CD4+ T cells and CD32− resting CD4+ T cells isolated using magnetic beads (n = 6). (C) FACS was performed to isolate total CD4+ T cells, CD32+ CD4+ T cells, CD32− CD4+ T cells, CD32− resting CD4+ T cells (HLA-DR− CD69− CD25−), CD32+ resting CD4+ T cells, CD32− activated CD4+ T cells (HLA-DR+ or CD69+ or CD25+), and CD32+ activated CD4+ T cells from freshly isolated PBMCs from HIV+ ART-suppressed individuals, and HIV DNA load was measured in all sorted populations (n = 10). Each patient is represented by a different symbol. Lines represent median. (D and E) Contribution of each cell population to the total pool of HIV DNA in CD4+ T cells calculated in 10 HIV+ ART-suppressed individuals. HIV total DNA copy number was determined in sorted subsets by qPCR. Each symbol represents a different individual. The contribution of each subset to the total pool of HIV DNA in CD4+ T cells was calculated by accounting for the frequency of these subsets within the CD4+ compartment and abundance of HIV DNA determined in each subset. Horizontal lines indicate median values. All statistical comparisons were performed using two-tailed Wilcoxon rank tests. *P < 0.05 and **P < 0.01.

