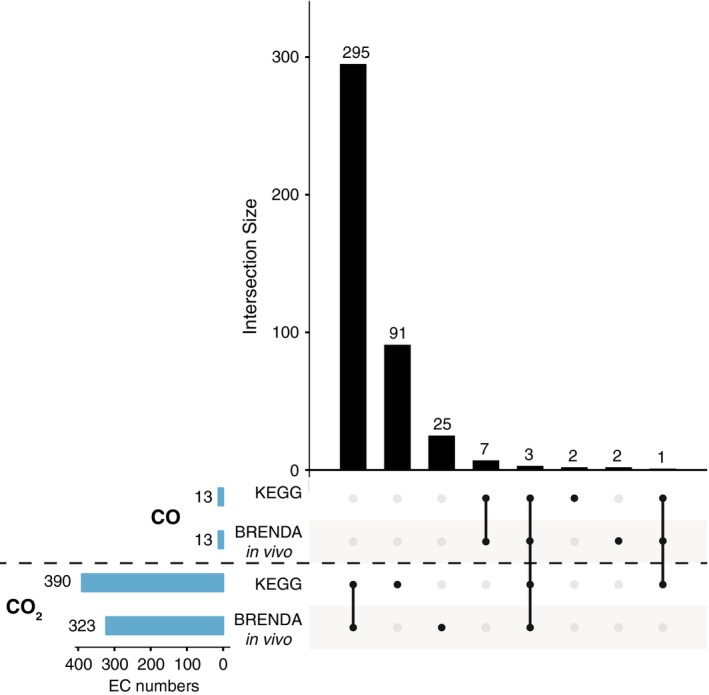
Figure 1.

Enzyme Commission (EC) numbers involving CO 2 and CO in KEGG and BRENDA (only in vivo reactions) and their overlaps. The horizontal bars display the total of EC numbers for each molecule in each database. The vertical bars display the size of the overlaps (intersections) between the databases.
