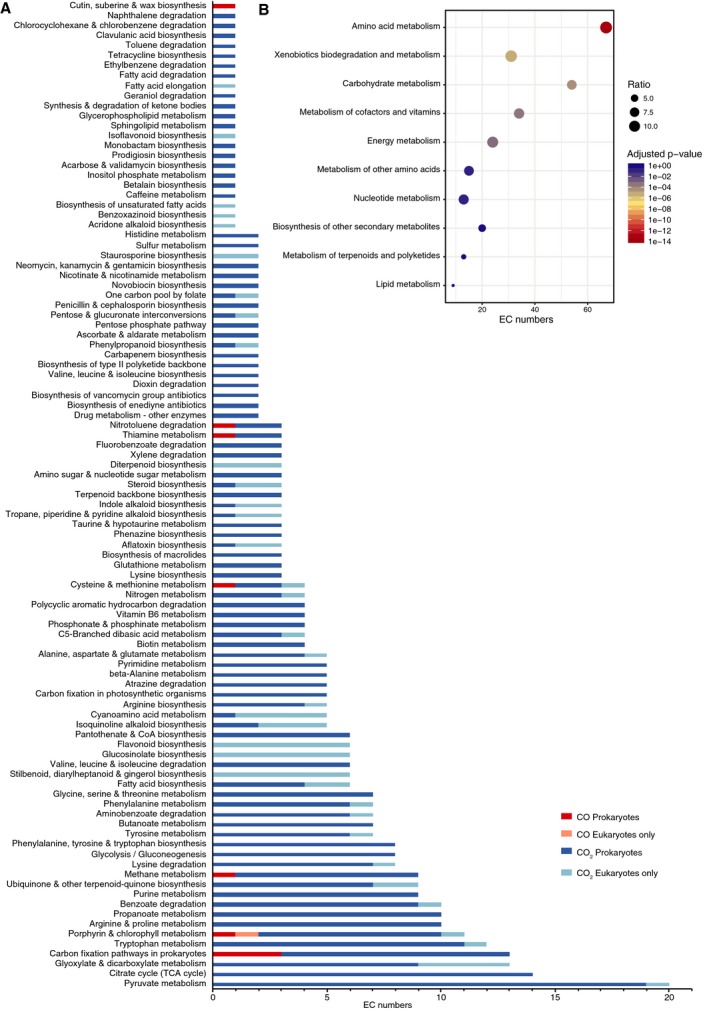
Figure 2.

Functional analysis of EC numbers involving CO 2 and CO. (A) EC numbers involving CO 2 (dark and light blue for those in prokaryotes and in eukaryotes only, respectively) and CO (dark and light red, accordingly). (B) Enrichment analysis (Fisher's exact test with adjusted p‐values by the Bonferroni correction) for high‐level functional categories of EC numbers involving CO 2 (prokaryotes only).
