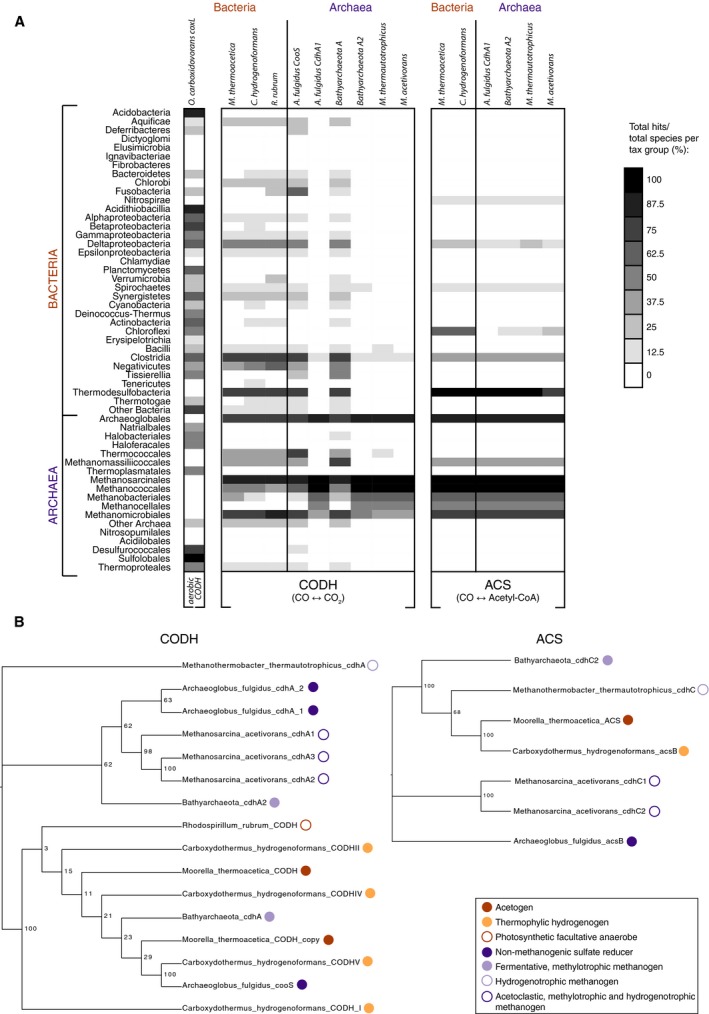
Figure 5.

Phylogenomic analysis of CO‐interconverting enzymes. (A) Distribution of genes encoding the CODH and ACS reactions. The left part of the figure lists the taxonomic groups from 5655 completed sequenced genomes (212 archaeal and 5443 bacterial). The presence‐absence patterns (PAPs) represent the proportion of genomes within a taxonomic group where each gene is present according to the discrete grey scale‐bar of binned intervals (top right, value indicates upper value of each bin). Each column represents a different gene selected from a different query species capable of performing the aerobic CODH (oxidative) reaction, the anaerobic CODH or both the (anaerobic) CODH and the ACS reactions (Oligotropha carboxidovorans, Moorella thermoacetica, Carboxydothermus hydrogenoformans, Rhodospirillum rubrum, Archaeoglobus fulgidus, Candidatus Bathyarchaeota archaeon BA1, Methanothermobacter thermautotrophicus and Methanosarcina acetivorans). Homologous proteins were predicted by BLAST with an E‐value threshold of 10−5 and filtering for global amino acid identities of at least 20% with Powerneedle (see Materials and methods). (B) Phylogenetic trees of the query sequences of CODH (left) and ACS (right) used to BLAST the RefSeq Database to build the PAPs in (A), numbers at branches are bootstrap values. Metabolic modes of the different species are marked in front of the respective sequences with colored circles according to the legend (bottom right).
