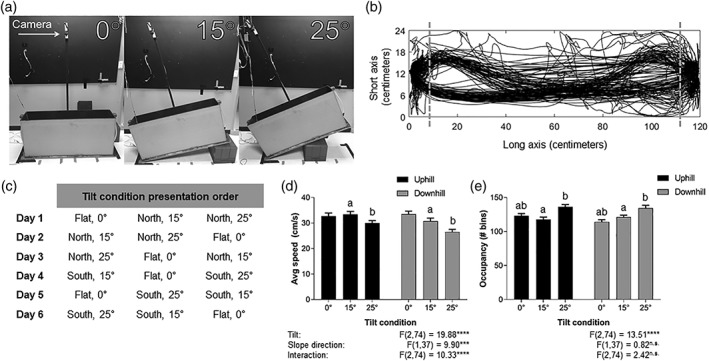
Figure 1.

Experimental setup and behavioral results. (a) Pictures of the experimental apparatus at the three tilt conditions with the location of the camera marked. (b) Schematic of the apparatus, the boundaries (dashed line) of the running region of interest and two endzones. The solid black tracing is the tracking data from one recording session showing the rat's running pattern. (c) Experimental sequence. Rats were run for six consecutive days with tilt condition presentation order counterbalanced across days. (d) Average running speed of the rats across all tilt‐slope direction conditions. Rat's speed slowed with increasing tilt angle and was slowest for downhill runs. Bars sharing the same letter are significantly different from one another. (a) Tukey's, p = 0.004 between uphill 15 ° and downhill 15 °; (b) Tukey's, p < 0.001 between uphill 25 ° and downhill 25 °. (e) The amount of space rats utilized while shuttling. Rat's tended to take more irregular routes on tilted conditions. Bars sharing the same letter are significantly different from one another. (a) Tukey's, p < 0.0001 between 0 ° and 15 °; (b) Tukey's, p < 0.0001 between 0 ° and 25 °
