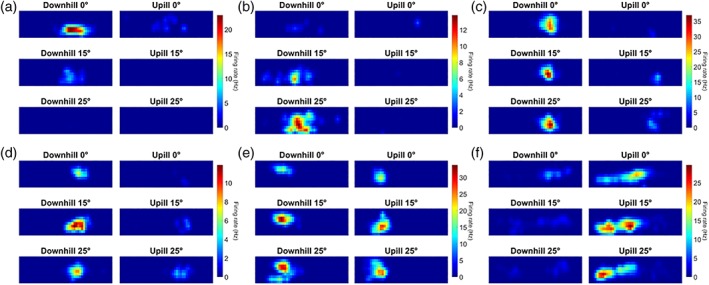
Figure 2.

Six example place cell firing rate maps (a–f), with firing of each cell illustrated across all six conditions. Every subplot shows the experimental apparatus as a series of 2.5 cm2 bins with the x and y axes corresponding to position in the shuttle box. The z‐axis is the firing rate of the cell in spikes per second (Hz) for each bin where warmer colors indicate a higher firing rate. For each place cell, the firing rate color scale across the three conditions is determined by the highest peak firing rate of the six tilt conditions. The left column of a plot shows Downhill runs while the right column shows Uphill runs. Each row of a plot corresponds to one of the three tilt conditions; top, 0 °; middle, 15 °; bottom, 25 °. Note that several cells fired specifically for one or two tilt conditions (e.g., a and b) [Color figure can be viewed in the online issue, which is available at http://wileyonlinelibrary.com.]
