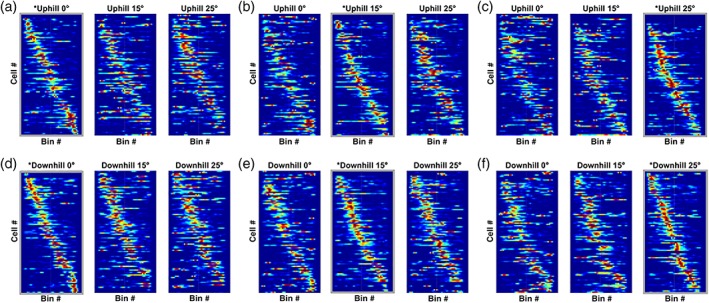
Figure 4.

Place cell sequence plots. Thus, the x axis represents the longitudinal extent of the apparatus and each row of the y axis is a place cell. Place cells are ordered based on their field location of one of the three tilt conditions (0 °, 15 °, and 25 °; from left to right) which served as the baseline. The baseline condition is indicated by a grey border and an asterisk in the title. The z axis is a cell's normalized firing rate; warmer colors represent a higher firing rate. Changes to the tilt have a substantial complex remapping effect on place cells as evidenced by the number of cells that turn on or off with a change in condition. Cells that are active for multiple tilt conditions generally have a stable place field location in the maze as indicated by the preserved place field location sequence across changes in tilt [Color figure can be viewed in the online issue, which is available at http://wileyonlinelibrary.com.]
