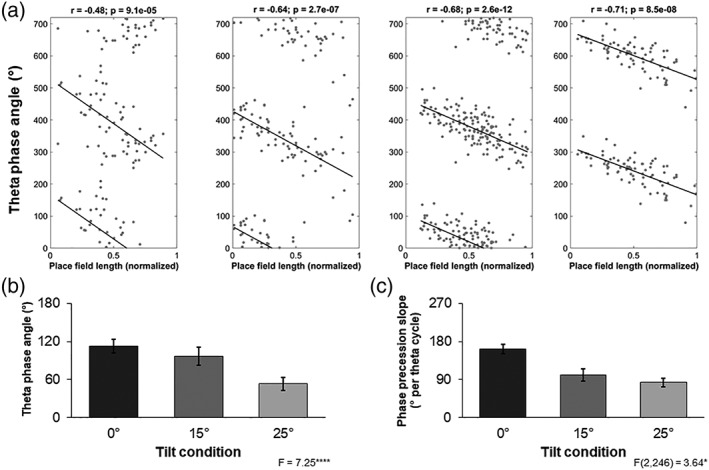
Figure 6.

Phase precession. (a) Examples of the phase precession of place cell spiking against theta activity as the animal traverses the place field from left to right. Zero degrees 0 ° corresponds to the trough in the negative portion of the filtered LFP recorded at the CA1 cell layer. Data points are reproduced twice over two theta cycles. The left plot is recorded from an animal moving on a flat surface while the middle two are tilted at 15 ° and the rightmost, 25 °. (b) Place cell firing phase, with reference to the underlying local theta as the animal enters the place field, is systematically shifting to earlier in the cycle as the apparatus is tilted. Data are mean angle and circular sem. (c) Phase precession slope decreases as the apparatus is tilted. The data are degrees per cycle
