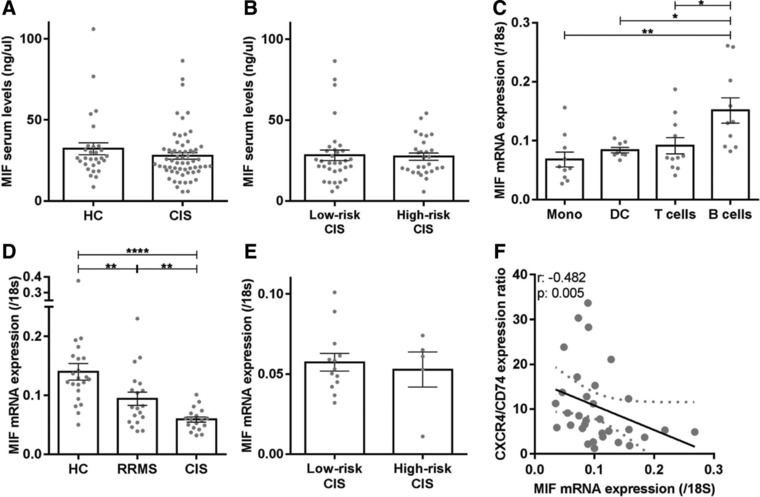
Figure 4.

Serum MIF levels are not different, while the predominant MIF expression in B cells is reduced in CIS and RRMS patients. MIF serum levels (ng/μL) were compared between CIS patients (n = 61) and HC (n = 29; (A), as well as between low‐risk CIS (n = 33) and high‐risk CIS (n = 28) subgroups (B) using ELISA. Data are measured in one single experiment. Each dot represents the mean value of one individual, measured in duplicates. (C) Monocytes (n = 10), dendritic cells (n = 8), T cells (n = 11), and B cells (n = 10) were sorted from healthy blood and assessed for MIF mRNA expression relative to those of 18S mRNA using qPCR. Data were collected in four independent experiments with 2–4 donors per experiment. Similar analyses were performed for blood B cells from CIS patients (n = 18), RRMS patients (n = 19), and HC (D; n = 22), as well as low‐risk CIS (n = 13) and high‐risk CIS (n = 5) groups (E). B cells of CIS patients were sorted in nine independent experiments with 2–4 patients per experiment. B cells of HC and RRMS patients were sorted in 17 independent experiments, with 1–2 HC and 1–2 RRMS patients per experiment. MIF and 18S mRNA expression was measured in six individual experiments, with two independent experiments per patient group. Data are shown as mean ± SEM. Each dot represents the mean value of one individual, measured in duplicates. Student's t‐tests were used to compare groups. (F) Correlation between MIF mRNA levels and CXCR4/CD74 surface expression ratios in B cells from patients and healthy controls (n = 30). B cells were sorted, mRNA was measured in duplicates, and surface expression was analyzed in six independent experiments with 2 HC and 2–4 patients per experiment. r = Spearman's correlation; *p < 0.05, **p < 0.01, ****p < 0.0001.
