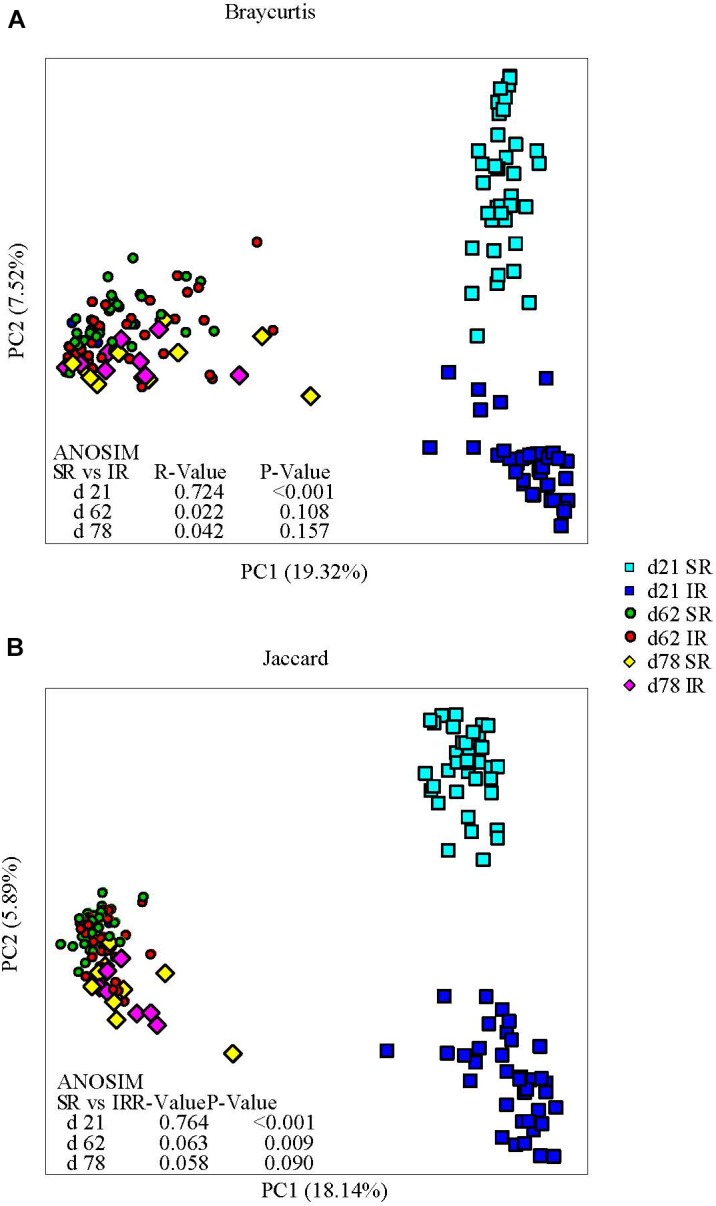
FIGURE 3.

Effect of rearing environment and source of nutrients during lactation on gut microbiome structure (A, Bray-curtis) and membership (Jaccard, B) demonstrated by principal coordinates (PC) analysis plots. Stool samples collected from days 21, 62, and 78 were illustrated by squares, circles and diamonds, respectively. The analysis of similarity (ANOSIM) procedure was used to test the statistical significance between groups. SR, sows reared; IR, isolated reared.
