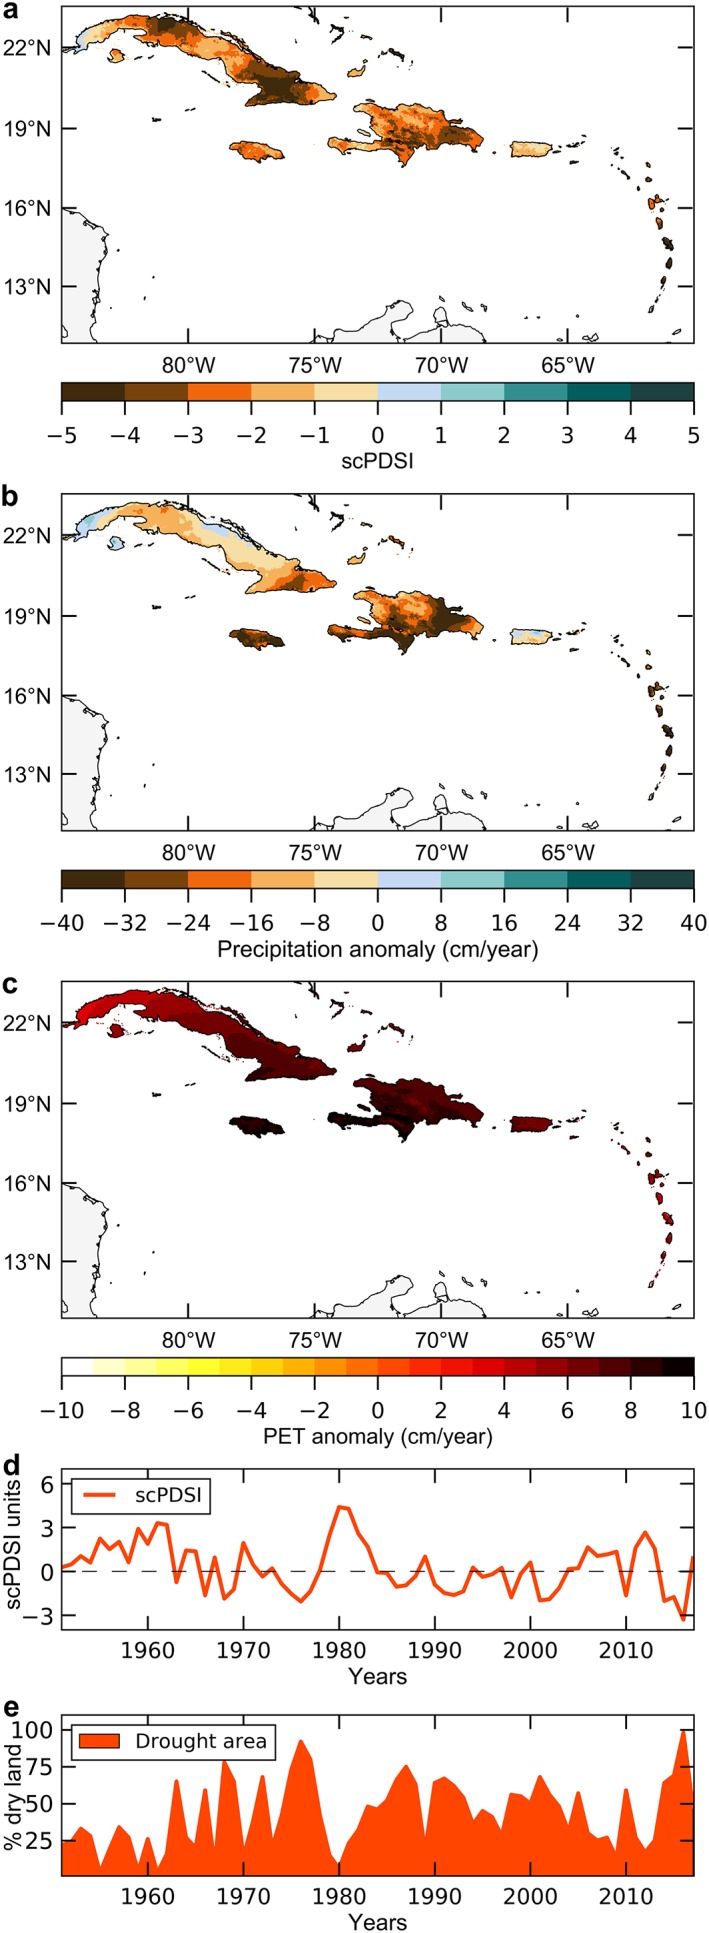
Figure 1.

Spatial and temporal characteristics of the Pan‐Caribbean drought: (a) scPDSI composite between July 2013 and October 2016, (b) and (c) are the same as (a) but with precipitation and Penman‐Monteith potential evapotranspiration (PET) anomalies, respectively. Both precipitation and PET anomalies are calculated as departures from the 1950–1980 climatology. The Caribbean averaged scPDSI time series is plotted in (d). Negative scPDSI values indicate drought, while positive values are pluvials. Finally, the drought area index between 1950 and 2016 across the Caribbean is plotted in (e). The Pan‐Caribbean drought affected ~98% of land area of the region. scPDSI = self‐calibrating Palmer Drought Severity Index.
