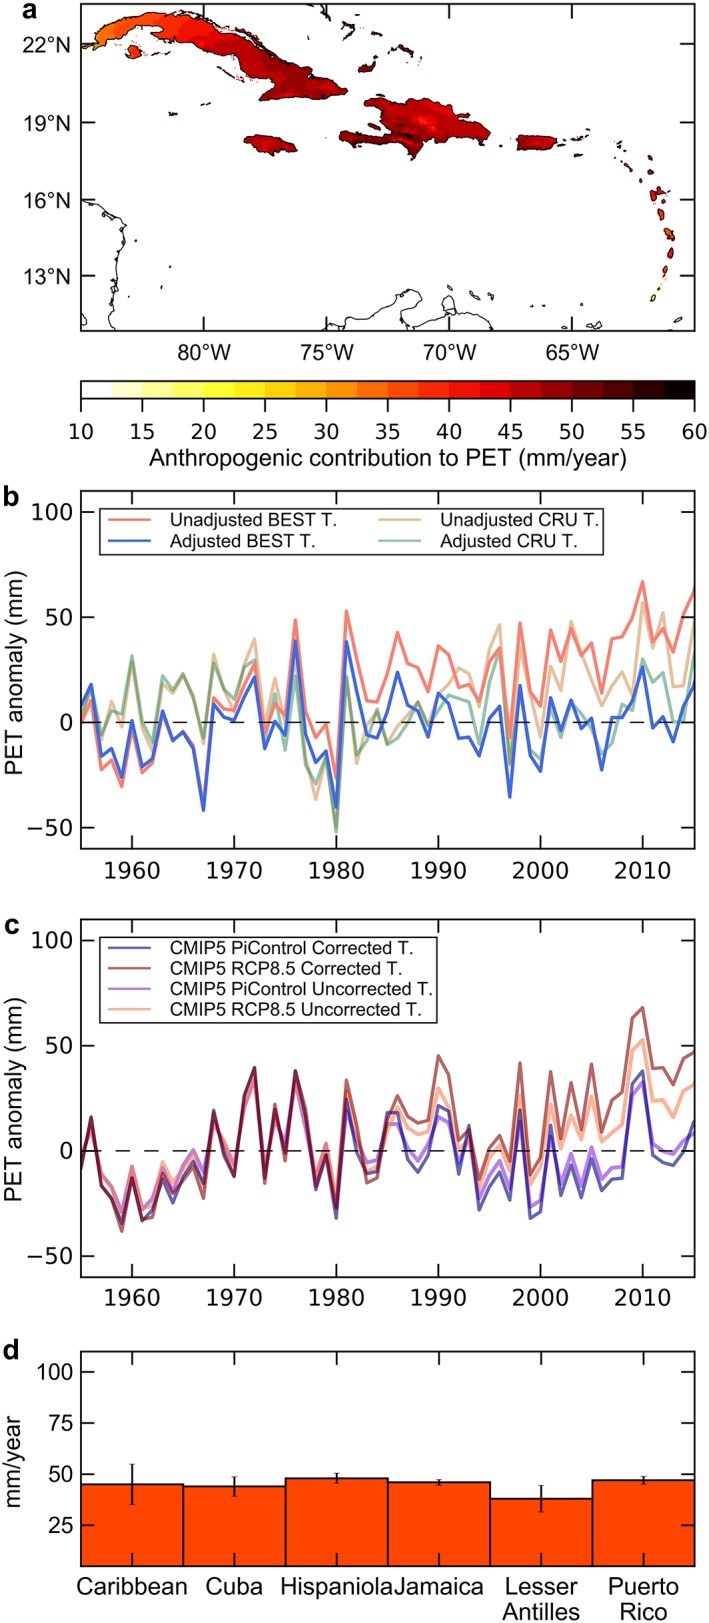
Figure 2.

Anthropogenic contributions to potential evapotranspiration (PET): (a) geographic distribution of anthropogenic contributions to observed PET anomalies in the Caribbean between 2013 and 2016. (b) PET‐anomaly time series estimated using observationally based temperature data. Reddish colors are PET anomalies calculated with unadjusted temperatures, while bluish colors group those calculated with adjusted temperatures (e.g., after the removal of the anthropogenic signal using a 30 low‐pass filter). (c) As in (b) but from CMIP5 outputs of bias‐corrected and not bias‐corrected temperatures using preindustrial control (bluish colors) and historical plus RCP8.5 (reddish colors), and (d) contributions to PET by island and the Lesser Antilles from observations. Differences between PET anomalies with and without the anthropogenic signal in (b) and (c) are statistically significant (p < 0.05) as evaluated using a two‐tailed t test. CRU = Climatic Research Unit; CMIP5 = Coupled Model Intercomparison Project phase 5.
