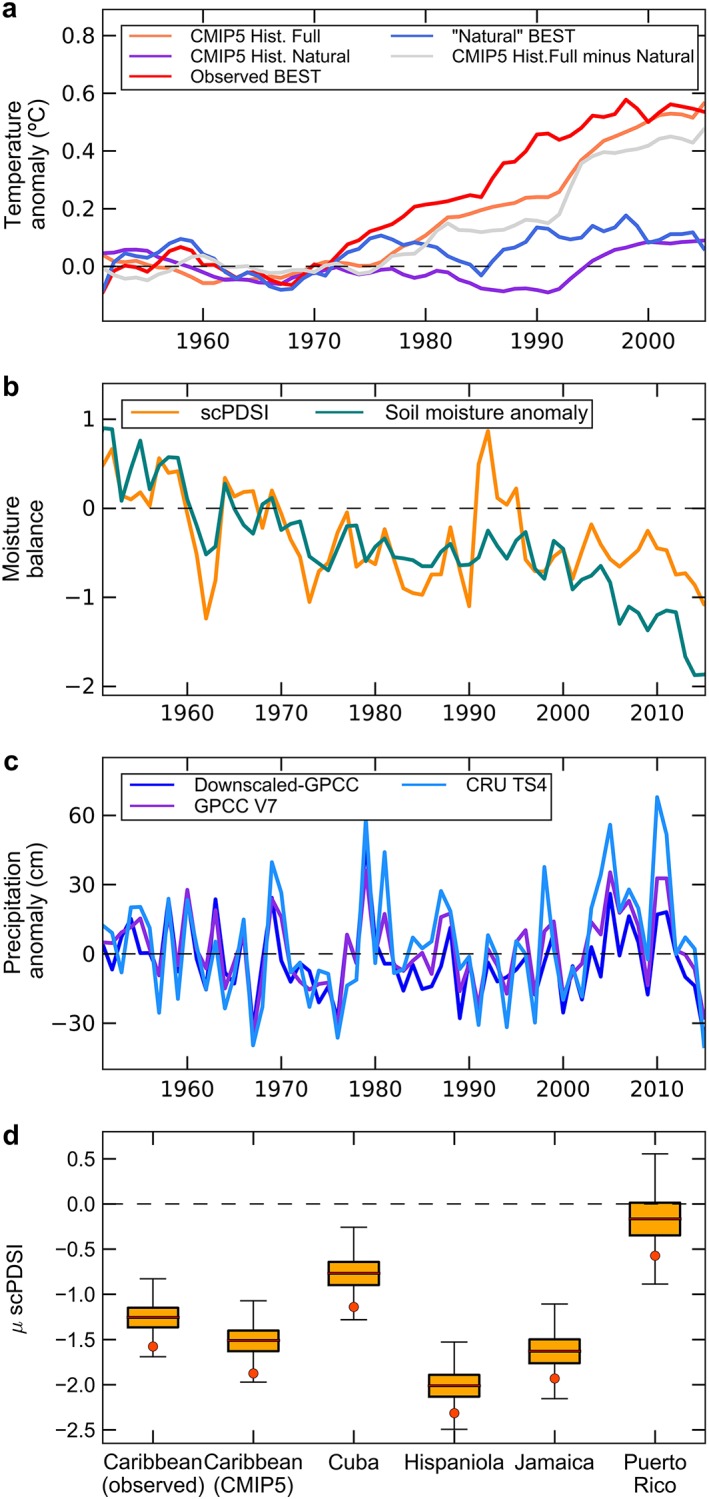
Figure 4.

(a) Instrumental and simulated 10‐year running mean of temperature anomalies in the Caribbean. Instrumental temperatures come from our statistically downscaled temperature estimates. Simulated temperatures come from a 15‐member ensemble of CMIP5 using fully forced and natural‐only forced historical simulations between 1950 and 2006. (b) Multimodel mean ensemble of simulated scPDSI and soil moisture anomalies during 1950–2016 from CMIP5. (c) Annual precipitation anomalies regionally averaged in the Caribbean. (d) The distribution of means from the 10,000 scPDSI resamples. scPDSI is calculated with adjusted temperatures for the Caribbean (using observed and simulated temperatures), for each of the Greater Antilles and the Lesser Antilles (using observed temperatures). The red dots represent the mean of the observed scPDSI for the Pan‐Caribbean drought. CMIP5 = Coupled Model Intercomparison Project phase 5; CRU = Climatic Research Unit; scPDSI = self‐calibrating Palmer Drought Severity Index; GPCC = Global Precipitation Climatology Centre.
