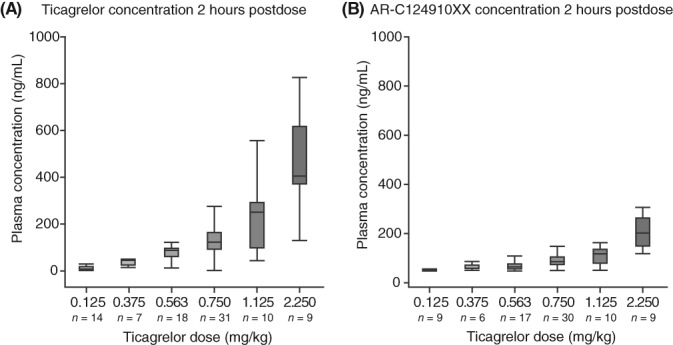
Figure 2.

Boxplots of observed plasma concentrations at 2 hours postdose of (A) ticagrelor and (B) AR‐C124910XX following a single ticagrelor dose. The boxplot whiskers display the 5th and 95th percentile of the data, values beyond this (outliers) are excluded from the graphs. Values below the limit of quantification of the bioanalysis method are not included
