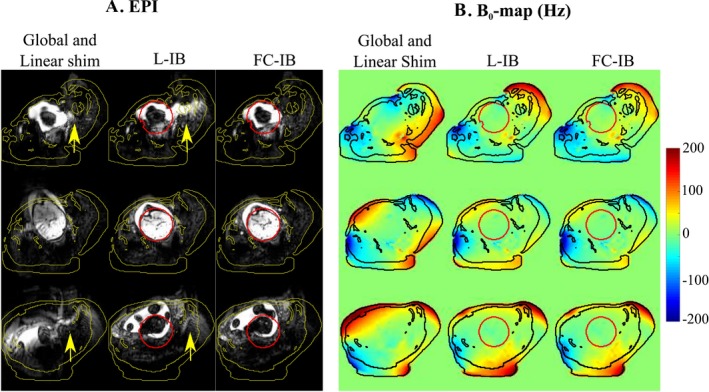
Figure 3.

EPI and residual B0 field frequency of the fetal brain in 3 slices of the same subject. (a) EPI in the fetal brain using (from left to right): global (full FOV) shim using only linear terms, localized IB shimming (L‐IB), and fat constrained IB shimming (FC‐IB) with optimal SPIR. (b) Residual B0 field frequency at the same position for global linear shim, L‐IB shimming, and FC‐IB shimming. The yellow arrows outline residual fat. Yellow lines delimit the regions determined by thresholding the Dixon images, which also represent fat in undistorted space. In the B0 field maps, the fat is outlined in black and the ROI of the fetal brain is shown in red
