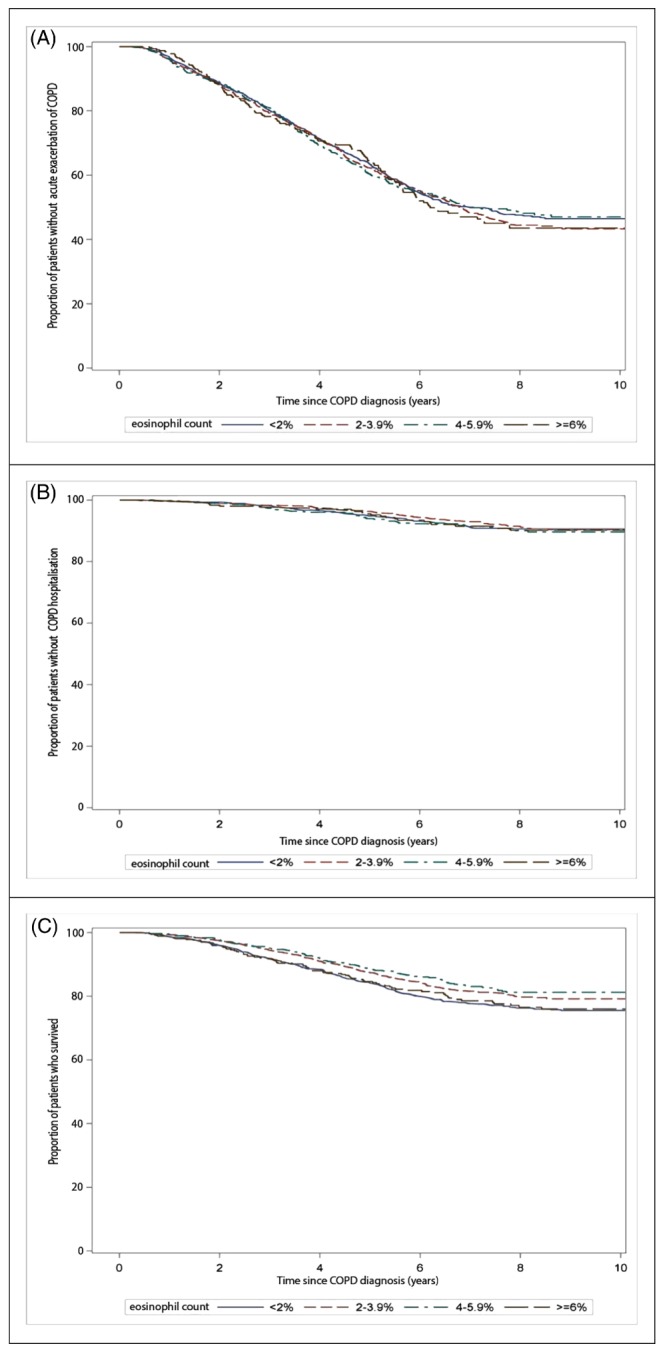
Figure 2.

Kaplan‐Meier curve showing (A) the proportion of patients without exacerbations with current ICS users stratified by blood eosinophil counts, (B) the proportion of patients without COPD hospitalisations/accident and emergency visits among current ICS users stratified by blood eosinophil counts, and (C) the proportion of patients who survived among current ICS users stratified by relative blood eosinophil counts [Colour figure can be viewed at http://wileyonlinelibrary.com]
