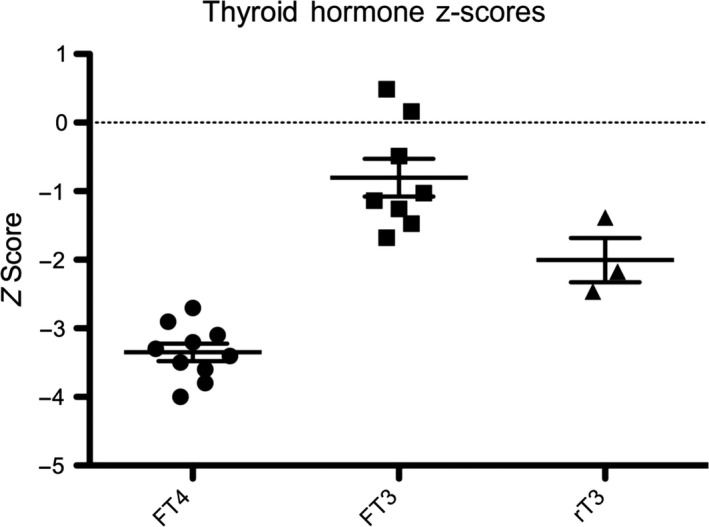
Figure 4.

Distribution of FT4, FT3 and rT3 Z‐scores in hemizygous p.L773P cases. Cases exhibit subnormal FT4, normal FT3 and low/low‐normal rT3 concentrations. Black horizontal lines represent the mean value; bars denote standard error of the mean (SEM). The population mean is denoted by the dashed line at 0
