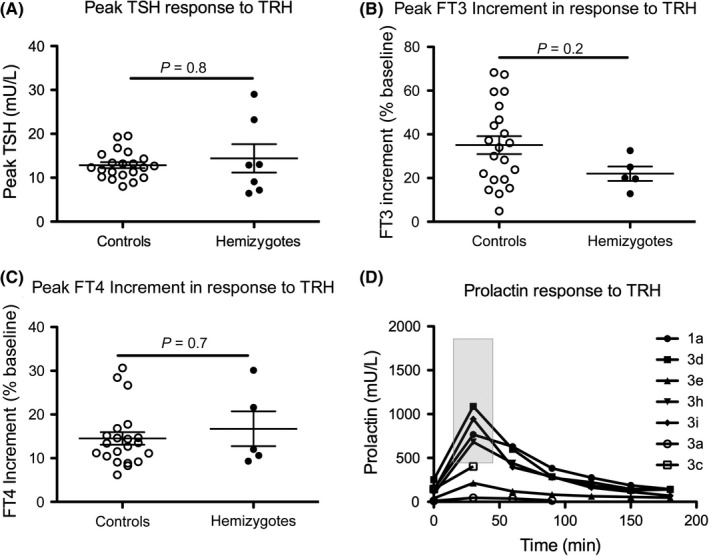
Figure 5.

Peak A, TSH, B, FT3, C, FT4 and D, sequential prolactin measurements during a TRH test in 7 (TSH, Prolactin) or 5 (FT3, FT4) hemizygous male cases aged 2.2‐75 years. Peak TSH and prolactin increment occurred at 20 mins in all cases and maximal FT3 increment, which was assessed using measurements up to 180 min after administration of TRH, usually occurred at 150 min (range 120‐180 min). Black horizontal lines represent the mean value; bars denote standard error of the mean (SEM), and P‐values were calculated using a Mann‐Whitney U test. The Grey box defines the reference range for prolactin peak in accordance with published literature; RR 421‐1829 mU/L, minimum to maximum 32
