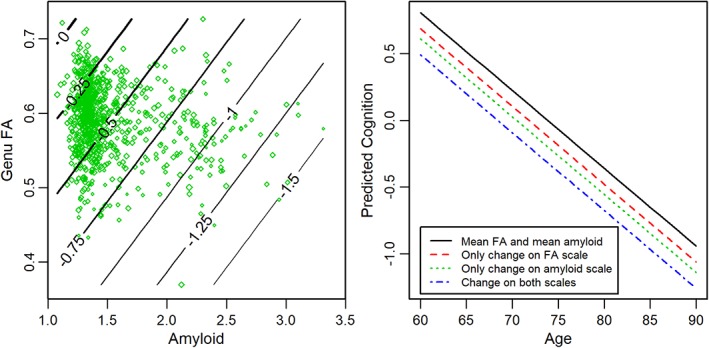
Figure 5.

(Left) Contour plot showing predicted cognition given fractional anisotropy (FA) and amyloid. The lines on the contour plot are predicted global cognitive z scores for an 80‐year‐old man for the mean education/occupation score (12.7) and mean cycle number (4.5). The predicted z score lines cover a range from a high of 0 (mean) to a low of −1.5 (1.5 standard deviations below the mean). The green diamonds are observed values, with larger sizes indicating higher observed z scores. (Right) The predicted cognition plotted by age for a given FA and amyloid level. The lines in the plot on the right are predictions for a male participant with the same characteristics as above. The solid black line shows the prediction for both FA and amyloid at their mean values. The additional lines are after FA and/or amyloid move by 1 standard deviation in the “bad” direction.
