Figure 3.

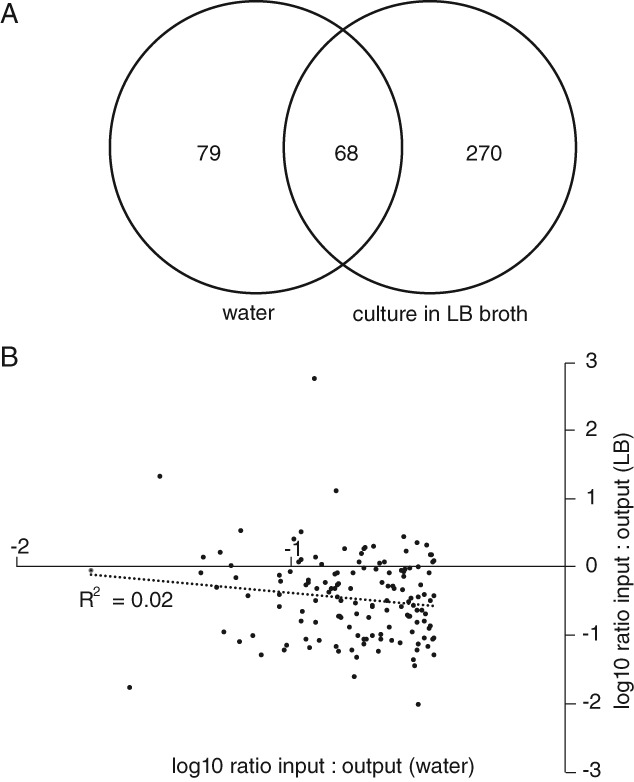
Comparison of candidate essential genes for optimal growth in LB broth and survival in water.A. Venn diagram indicating the union of genes with TraDIS reads greater than three‐fold mapped in the input compared with output pools following culture in LB broth or in water for 24 h.B. The ratio (log10) of mapped reads in the output pool compared with the input pool following culture in LB broth or in water for 24 h. The regression line and R square are indicated.
