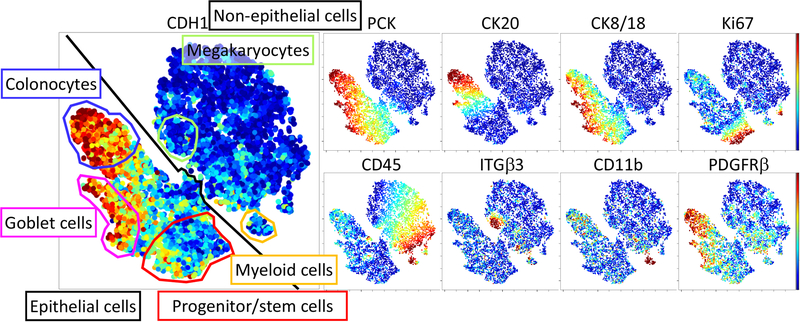
Fig. 4. t-SNE analysis of cell populations from Cryo-DISSECT mass cytometry data of the human colon.
Heat overlays (low to high) represent the Arcsinh-transformed expression level of indicated proteins determined by mass cytometry. Cell populations (color-coded gates) were manually identified on the t-SNE plot based on marker expression, as detailed in Fig. 3.

