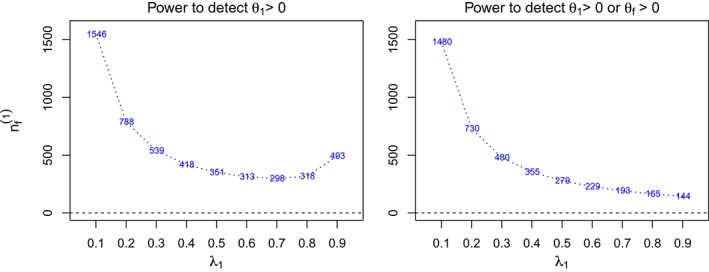
Figure 1.

The total sample sizes of the full population F ( ) across prevalence rates of S 1 (λ1) for two different definitions of power. The design is a single‐stage design with two subpopulations where the treatment effects θ 1 and θ 2 for S 1 and S 2 are 0.5 and 0, respectively. The type‐I error and power are specified at 0.025 and 80% [Colour figure can be viewed at http://wileyonlinelibrary.com]
