
Figure 4.
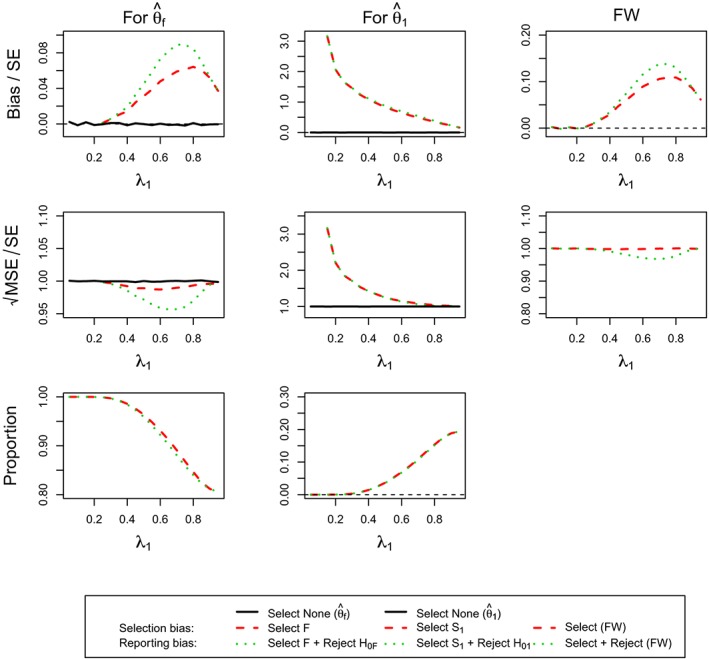
(For Design 1, θ 1 = 0.5 and θ 2 = 0.5) the standardized bias and standardized of maximum likelihood estimators , and the simulation proportions for different circumstances against the prevalence of subpopulation 1, ie, λ1. FW, family‐wise; MSE, mean squared error [Colour figure can be viewed at http://wileyonlinelibrary.com]