
Figure 7.
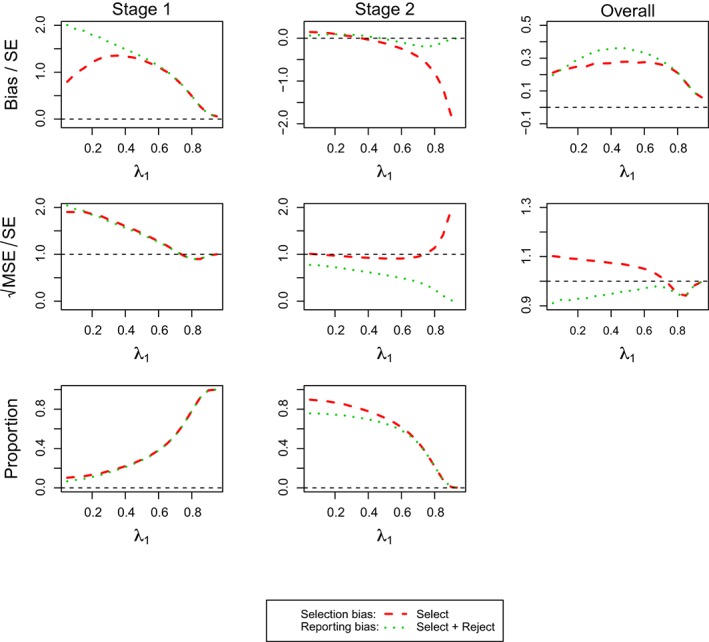
(For Design 3, θ 1 = 0.5 and θ 2 = 0) FW bias and mean squared error and simulation proportions for different circumstances at stopping stage 1, 2, and overall, against the prevalence of subpopulation 1, ie, λ1 [Colour figure can be viewed at http://wileyonlinelibrary.com]