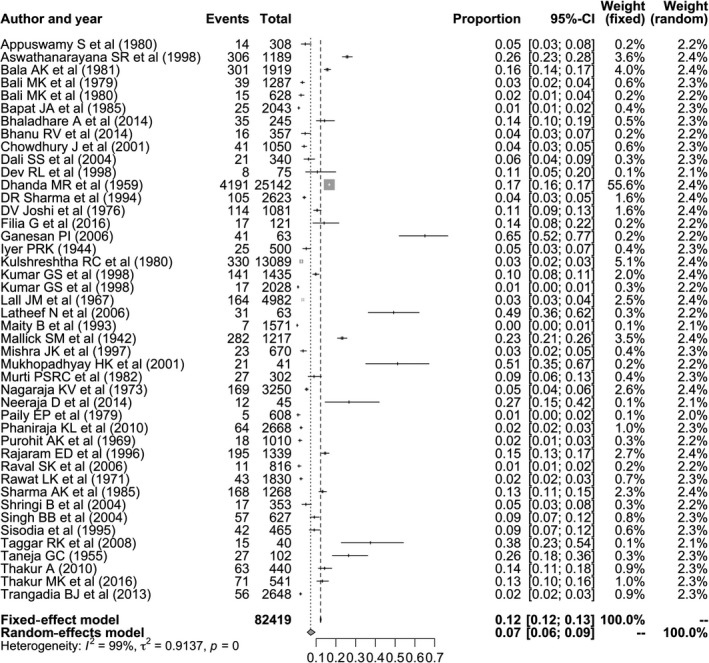
Figure 3.

Forest plot visualizing the varying bTB prevalence reported for each included publication in the meta‐analysis. Weightage given to each included publication by both RE and FE models have been shown for rigorous comparison. “Total” refers to the number of animals in each publication, while “Events” refers to the number of bTB‐positive animals. “Proportion” reports the bTB prevalence for each publication
