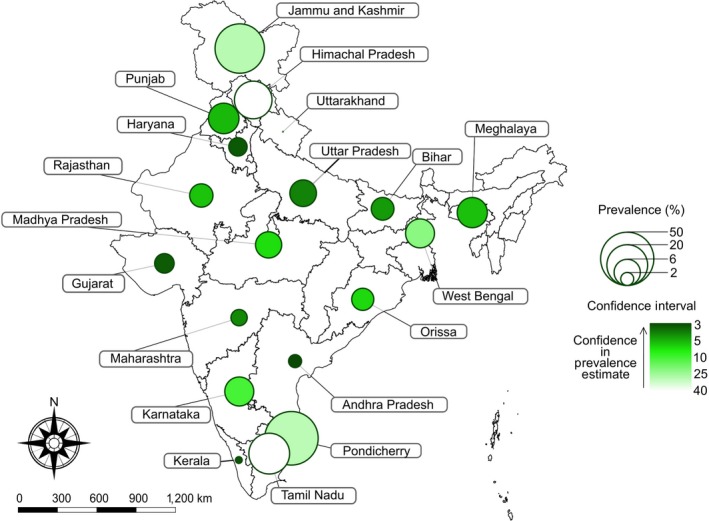
Figure 4.

Geographical distribution and pooled prevalence estimates (RE model) of bTB in the different states of India. For the confidence intervals, a power scale was used to map colour lightness and represented as y = mxk + b, where k = 0.5. Prevalence was mapped to a log‐scale where data were uniformly corrected with allow for visual properties. Note that although scales were altered, the original data set is provided in Table 7 to afford accurate measures [Colour figure can be viewed at http://wileyonlinelibrary.com]
