
Figure 2.
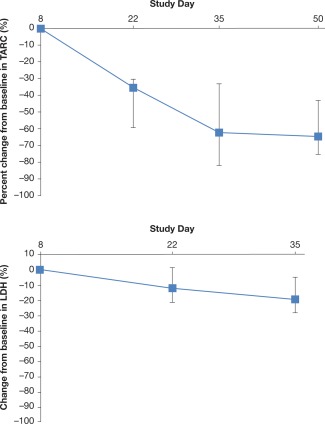
Median percent change from baseline (Q1–Q3 range) in serum concentrations of (a) TARC and (b) LDH. LDH, lactate dehydrogenase; TARC, thymus and activation regulated chemokine. [Color figure can be viewed at http://wileyonlinelibrary.com]
Official websites use .gov
A
.gov website belongs to an official
government organization in the United States.
Secure .gov websites use HTTPS
A lock (
) or https:// means you've safely
connected to the .gov website. Share sensitive
information only on official, secure websites.
Median percent change from baseline (Q1–Q3 range) in serum concentrations of (a) TARC and (b) LDH. LDH, lactate dehydrogenase; TARC, thymus and activation regulated chemokine. [Color figure can be viewed at http://wileyonlinelibrary.com]