Figure 4.

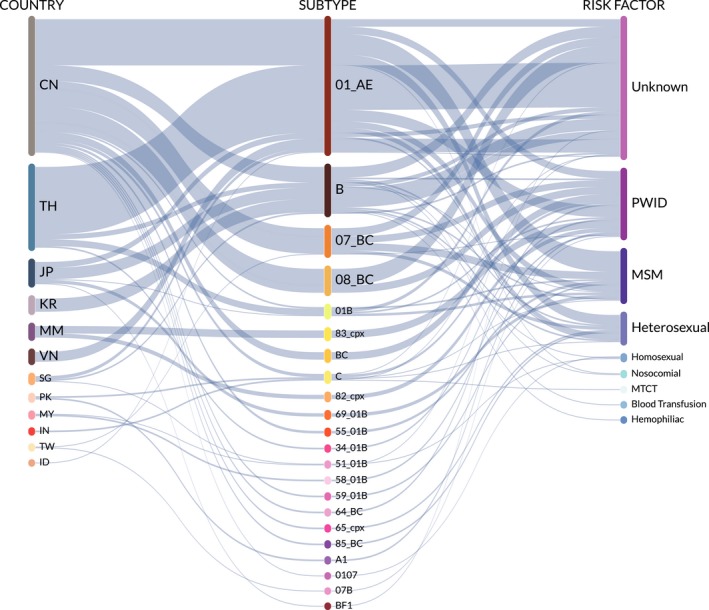
Sankey diagram depicting the relative proportions of countries, subtypes and risk factors of nodes identified in the Asia transmission network

Sankey diagram depicting the relative proportions of countries, subtypes and risk factors of nodes identified in the Asia transmission network