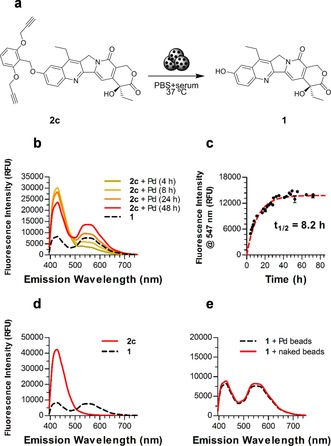
Figure 3.

(a) Palladium‐catalyzed conversion of 2 c into 1. (b,c) Rate of transformation of 2 c (100 μm) into 1 in the presence of Pd0 (1 mg mL−1 Pd‐devices) in PBS+10 % serum at 37 °C. (b) Monitoring of changes in fluorescence spectra over time. (c) Increase of fluorescence intensity at 547 nm over time (d) Control experiment: fluorescence spectra of 2 c (100 μm) after 2 d in biocompatible conditions in the presence of naked beads. Black line represents the fluorescent spectra of 1 (100 μm). (e) Control experiment: fluorescence spectra of 1 after 2 d in biocompatible conditions in the presence of Pd‐devices (dotted line) or naked beads (solid line).
