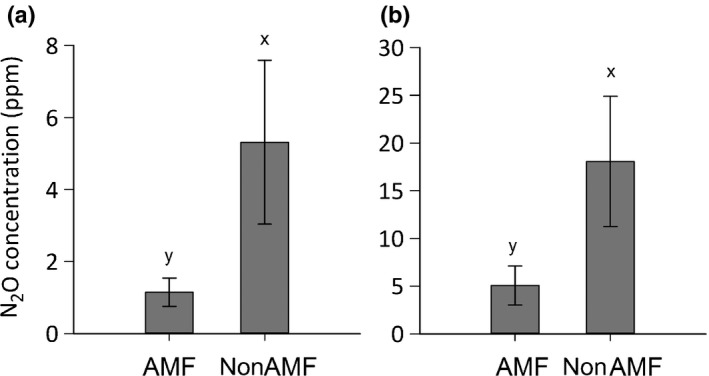
Figure 2.

Mean N2O concentration (ppm) in arbuscular mycorrhizal fungal access (AMF) and no AMF access (nonAMF) organic matter patches at 43 d after patch addition in Expt 1 (a) and at 58 d after patch addition in Expt 2 (b). Error bars are ± SEM (a, n = 12; b, n = 39). Different letters represent significant differences at P < 0.05 as determined using: (a) two‐way ANOVAs; and (b) by comparing the ∆AMF value with zero (Wilcoxon signed‐rank test).
