
Figure 4.
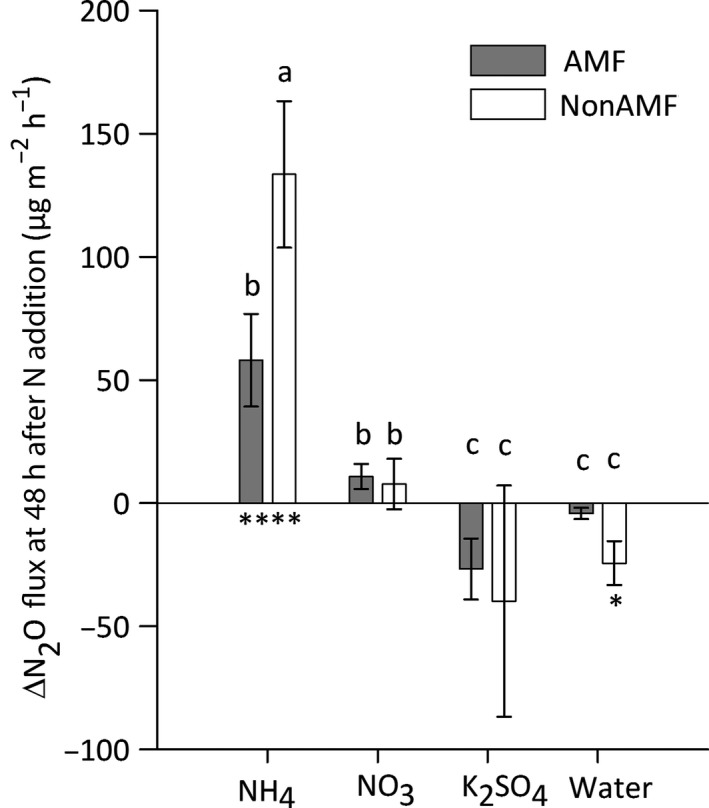
Mean difference between 48 h post‐nitrogen (N) addition (64 d after patch addition) and pre‐N addition (61 d after patch addition) nitrous oxide (N2O) fluxes (∆N2O flux) for arbuscular mycorrhizal fungal access (AMF; closed bars) and no AMF access (nonAMF; open bars) treatments, split by N‐addition treatment. The N‐addition treatments were (NH 4)2 SO 4 (labelled as NH 4), KNO 3 (labelled as NO 3), K2 SO 4 or water. Bars with different letters are significant at P = 0.0018 as determined by Mann–Whitney U or Wilcoxon signed‐rank post hoc tests with a false discovery rate correction applied. Asterisks below the bars indicate significant differences from zero (*, P < 0.05; **, P < 0.01). Error bars are ± SEM (n = 10).