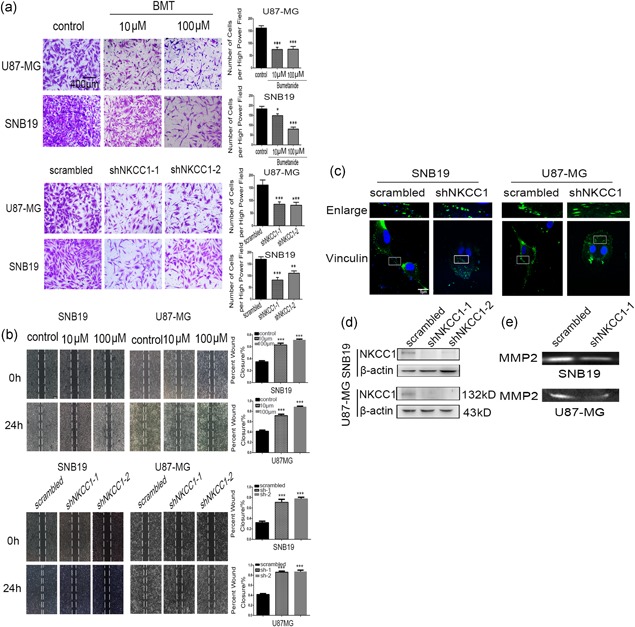
Figure 3.

Inhibited NKCC1 decreased the invasion and migration of U87‐MG and SNB19 cells. (a) Glioma cell invasion was assessed with a Transwell assay after the knockdown of NKCC1 or treatment with bumetanide. The scale bar corresponds to 400 μm. (b) A wound healing assay was used to evaluate cell migration ability after knockdown of NKCC1 or treatment with bumetanide after 24 hr. The scale bar corresponds to 500 μm. (c) Immunofluorescent staining for vinculin revealed differences in focal adhesions between the scrambled and NKCC1 knockdown glioma cells. The scale bar corresponds to 5 μm. (d) Silencing of NKCC1 in U87‐MG and SNB19 as detected by western blotting. β‐actin was used as a positive control. (e) MMP2 was detected by western blotting after knockdown of NKCC1. (*p < 0.05; **p < 0.01; ***p < 0.001). MMP2: matrix metallopeptidase 2; NKCC1: sodium‐potassium‐chloride cotransporter 1 [Color figure can be viewed at wileyonlinelibrary.com]
