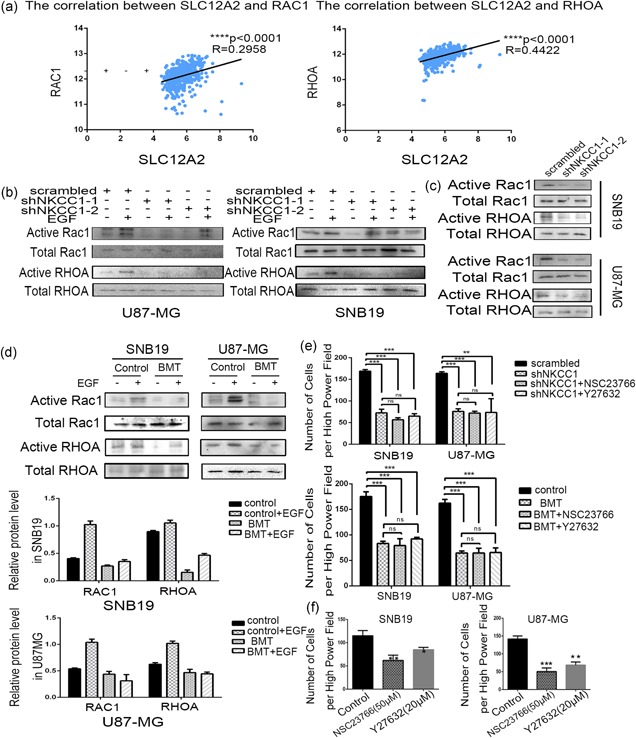
Figure 5.

Rac1 and RhoA signaling mediated NKCC1‐induced EMT. (a) Pearson correlation analysis between the SLC12A2 and RAC1/RHOA mRNA expression in TCGA data sets. (b,c) Knockdown NKCC1 decreased actived Rac1/RhoA levels in U87‐MG and SNB19 cells detected by western blotting. (d) Bumetanide (100 μM) treated after 24 hr decreased actived Rac1 and RhoA levels. β‐actin was used as a positive control. (e) A Transwell assay showing the invasion power of U87‐MG and SNB19 cells using NKCC1 knockdown, sh‐ NKCC1 combined with NSC23766 or Y‐27632. A Transwell assay using bumetanide and NSC23766/Y‐27632 combination. (f) NSC23766 and Y‐27632 decreased the invasion of glioma cells detected by a Transwell assay. (*p < 0.05; **p < 0.01; ***p < 0.001). EMT: epithelial–mesenchymal transition; NKCC1: sodium‐potassium‐chloride cotransporter 1; TCGA: The Cancer Genome Atlas [Color figure can be viewed at wileyonlinelibrary.com]
