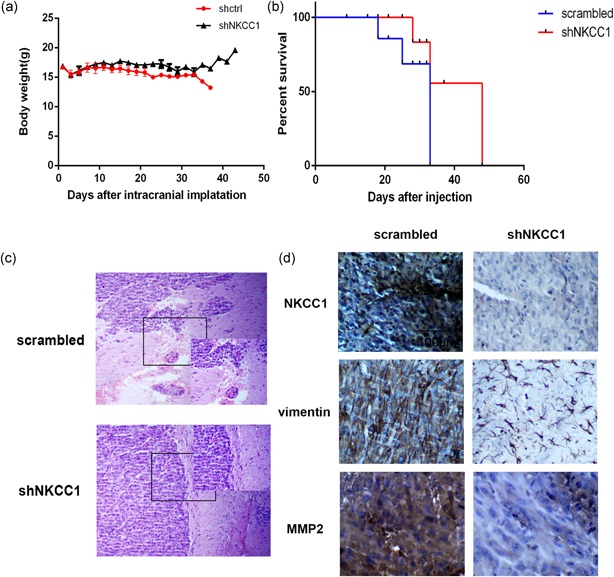
Figure 6.

Downregulation of NKCC1 inhibited invasion in intracranial nude mouse. (a) Mouse body weight was recorded as a measure of mouse nutrition in the two groups. (b) A survival curve was used to detect differences in mouse survival times between the two groups. (c,d) Immunohistochemistry analysis of the H&E and expression of NKCC1 and MMP‐2 and vimentin between NKCC1‐shRNA‐treated tumors compared to tumors in the scrambled group. The scale bar corresponds to 100 μm. (*p < 0.05; **p < 0.01; ***p < 0.001). MMP‐2: matrix metallopeptidase 2; NKCC1: sodium‐potassium‐chloride cotransporter 1 [Color figure can be viewed at wileyonlinelibrary.com]
