
Figure 2.
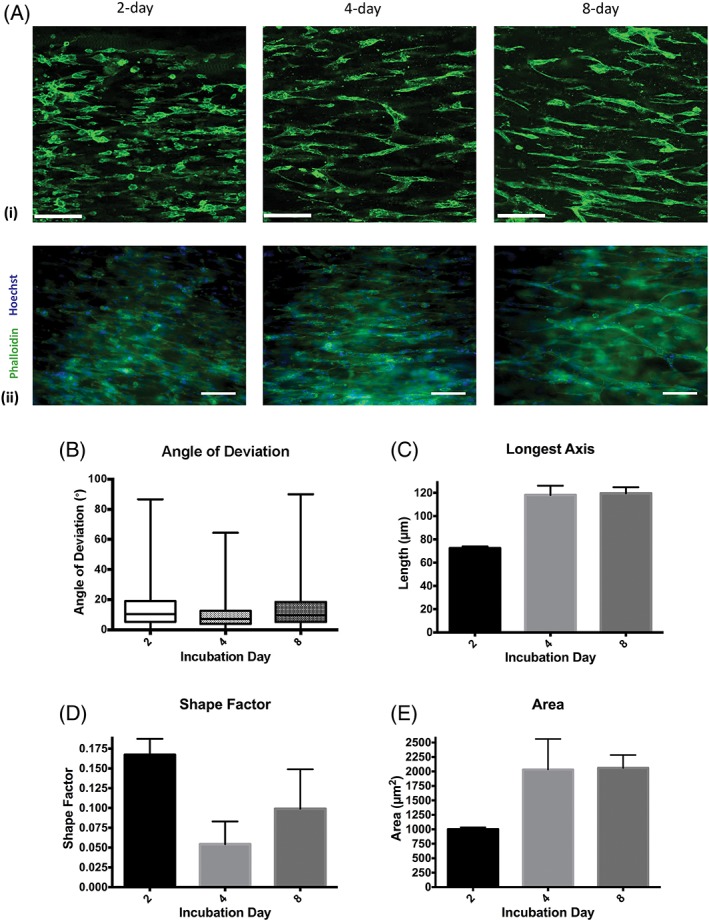
Self‐alignment of HUVECs and formation of tube‐like structures within tethered collagen gels. Confocal micrographs (A(i)) and immunofluorescence images (A(ii)) show aligned HUVECs forming vascular networks after 2, 4, and 8 days in culture, z‐distance 20 μm, step size 1 μm. Three‐dimensional image analysis was used to calculate the angle of deviation between HUVEC/tube alignment and the longitudinal axis of the gel (B). Boxes show interquartile range and median values, whiskers indicate maximum and minimum angles (N = 3 gels). The length of tube‐like structures (C), shape factor which determine how round the object is (values closer to 1 indicate more rounded shape) (D) and surface area (E) were compared in 2‐day, 4‐day, and 8‐day cultured gels. Graphs show mean value ± SEM. (N = 3 gels). Scale bars in (A(i)) = 120 μm and in (A(ii)) = 100 μm.