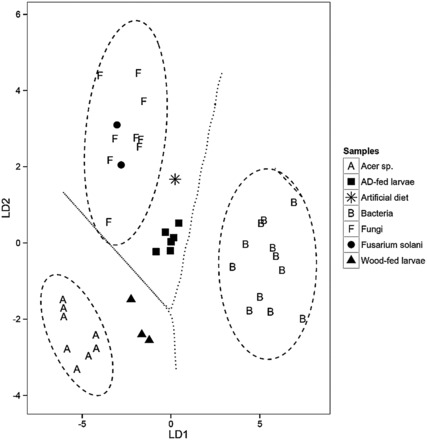
Fig. 2.

A linear discriminant function analysis (LDA) using δ 13 C EAA from (A) wood-fed and artificial diet-fed larvae with three classifier groups: maple trees ( Acer sp .; n = 8), fungi ( n = 9), and bacteria ( n = 12), and four predictor groups: A. glabripennis wood-fed larvae ( n = 3), A. glabripennis artificial diet-fed larvae (AD-fed larvae; n = 6), the artificial diet food source (AD; n = 1), and the fungal symbiont F. solani ( n = 2). Classification along LD1 (83.5%) accounts for the separation between Acer sp. , bacteria, and fungi. The classification along LD2 (16.5%) accounts for the separation between Acer sp. and fungi (Wilks’ Lambda = 0.01, F = 49.2, P < 0.0001). Letters indicate classifiers groups, while shapes indicate consumers. The ellipses signify the 95% confidence limits for each classifier group, and the dashed lines between classifiers signify the decision boundaries for each classifier group. The essential amino acids used in both plots were isoleucine, leucine, lysine, phenylalanine, and valine.
