Figure 4.
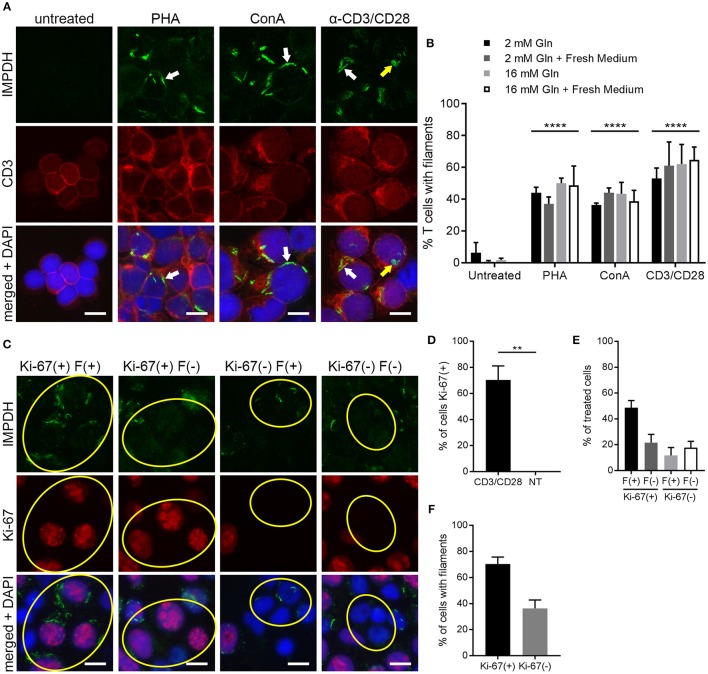
IMPDH forms filaments during ex vivo primary human T cell activation. (A) Representative images of T cells left untreated or stimulated by mitogens PHA, ConA, or anti-CD3/CD28 for 72 h, then fixed and stained for IMPDH (green) and T cell marker CD3 (red). White arrows: examples of IMPDH filaments. Yellow arrows: example of a ring-shaped filament. Images were captured using identical microscope settings for all treatment groups. (B) Quantification of the percentage of T cells that form filaments when untreated or treated with mitogens PHA, ConA, or anti-CD3/CD28. Cells were cultured in RPMI 1640 under four different conditions: 2 mM glutamine (Gln), 2 mM Gln + 1 h fresh medium, 16 mM Gln, or 16 mM Gln + 1 h fresh medium (represented by differently shaded bars). Different culture conditions were grouped together according to mitogenic treatment and compared to untreated cells (e.g., all PHA-treated conditions grouped vs. all untreated conditions grouped) and statistical significance displayed above each group. No significant differences were observed within these treatment groups due to culture conditions (e.g., PHA 2 mM Gln vs. PHA 16 mM Gln, no difference). Statistical test used: two-way ANOVA followed by Tukey's multiple comparisons test; ****p < 0.0001. Data are shown as mean ± S.E.M. and represent three independent experiments using 3 different human donors. (C) Representative images of PBMCs stimulated by anti-CD3/CD28 and stained for IMPDH (green) and proliferation marker Ki-67 (red). Yellow circles show examples of 4 different cell populations quantified in subsequent panels: Ki-67(+) filament(+), Ki-67(+) filament(–), Ki-67(–) filament(+), Ki-67(–) filament(–). (D) Quantification of the percentage of Ki-67-positive cells in anti-CD3/CD28-treated cells compared to untreated (NT) cells. Statistical test used: two-tailed Student's t-test; **p < 0.01. (E) Graph showing the proportion of anti-CD3/CD28-treated cells made up by the four different cell populations shown in (C) (all four groups add up to 100%). (F) Comparison of the percentage of treated cells with filaments between Ki-67-positive and Ki-67-negative cell populations from the experiment in (C). (E,F) show proportions calculated from within the treated group only (anti-CD3/CD28-treated) and do not represent data from independent groups. Common statistical tests used to compare independent groups are not appropriate to analyze the outcome of these experiments, so no statistical significance is indicated. Data from (D–F) are shown as mean ± S.E.M. and represent 3 independent experiments. Counterstain for all panels: DAPI (blue). Scale bars: 10 μm.

