
Figure 2.
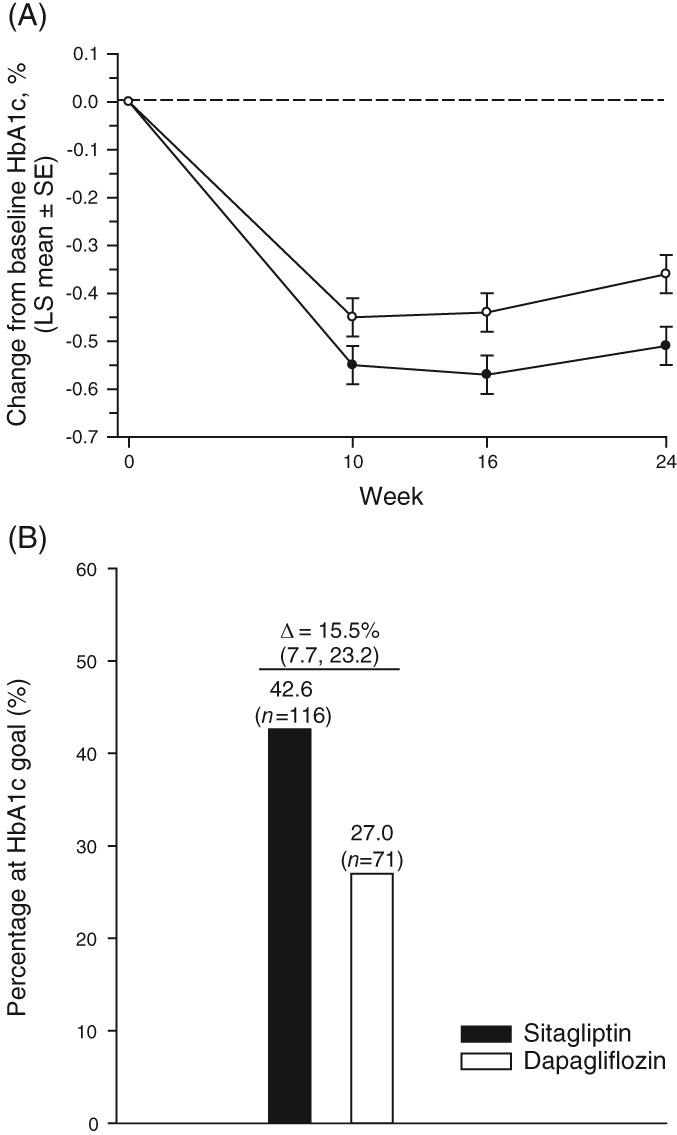
HbA1c measures through week 24: A, LS mean ± SE change from baseline HbA1c (%); black circles = sitagliptin, open circles = dapagliflozin; B, percentage of patients at goal of HbA1c <7% at week 24. For both A and B, results were calculated using the LDA model described in Methods