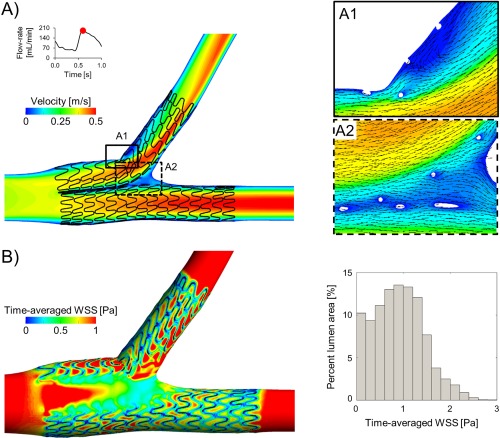
Figure 2.

Simulation of blood flow patterns in SKS using computational fluid dynamics. A, Velocity contours in the middle plane at peak flow‐rate. Panels A1 and A2 show a magnified image of the velocity field with in‐plane velocity vectors at the Cx origin and at the carina, respectively. B, Contour map of time‐averaged wall shear stress (WSS). The histogram on the right shows the area distribution of time‐averaged WSS in the stented region. The bars represent the percentage of lumen area with a defined range of time‐averaged WSS values. Bin widths are 0.2 Pa
