
Figure 5.
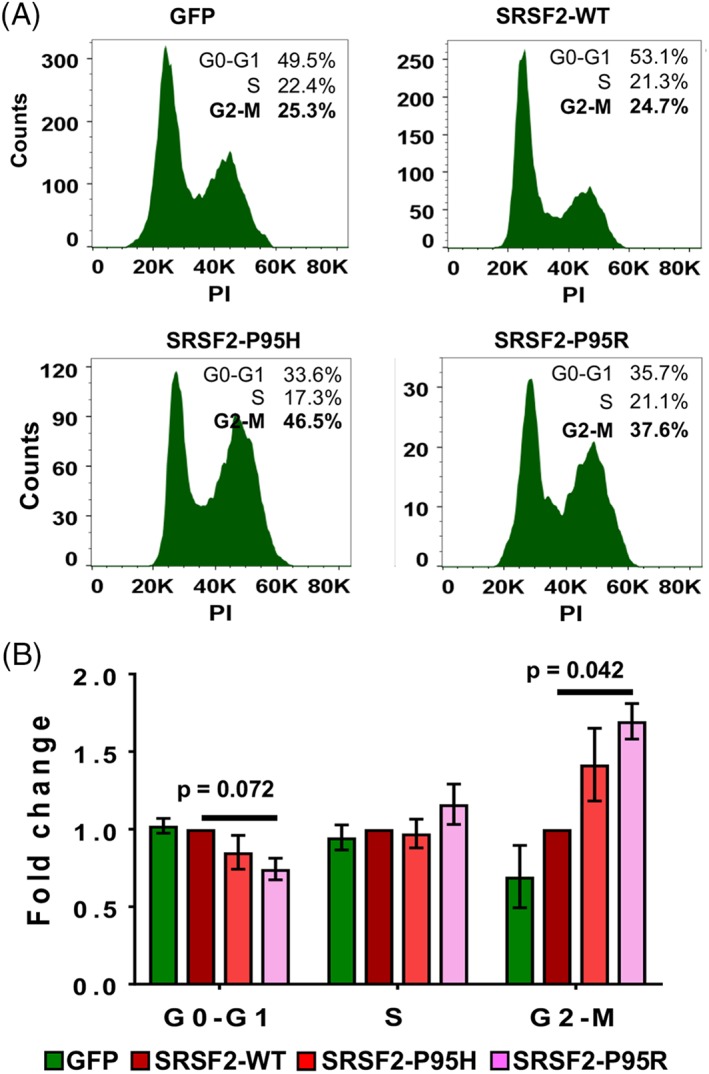
SRSF2 mutations cause a G2‐M phase arrest in the CD34+ cells. Cell cycle phase distribution of CD34+/GFP+ cells was determined by DNA content measurements after propidium iodide staining on day 14 post‐transduction. (A): Histograms for cells expressing GFP alone, SRSF2‐WT, SRSF2‐P95H, and SRSF2‐P95R from a representative experiment are shown. (B): Fold change in percentages of the G0‐G1, S, and G2‐M phases were calculated relative to wildtype. All data are represented as mean ± standard error of three independent experiments. The p values were calculated using the Mann–Whitney test in GraphPad Prism v7. The p values ≤.05 were considered significant and are shown.