
Figure 2.
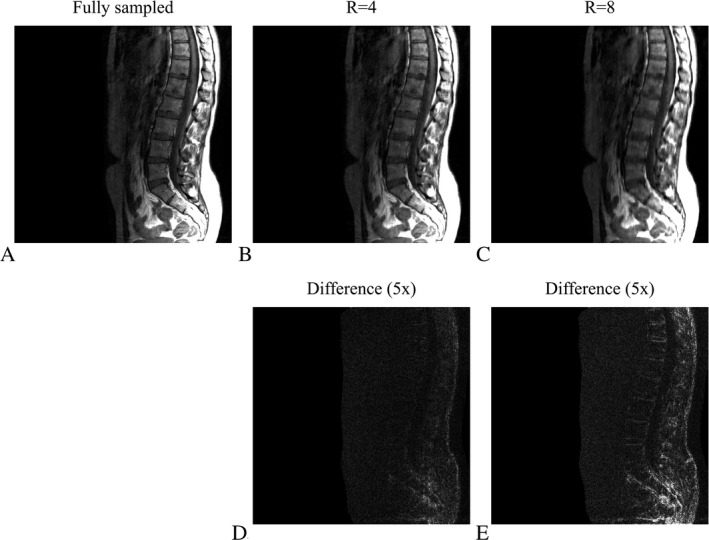
Reconstruction results for different structured Cartesian undersampling factors. (A) shows the fully sampled scan as a reference, whereas (B) and (C) depict the reconstruction results for undersampling factors four (R = 4) and eight (R = 8), respectively. The absolute difference, magnified five times, is shown in (D) and (E) for R = 4 and R = 8, respectively. The reconstruction matrix has dimensions 512 × 512. Regularization parameters were set to , and .